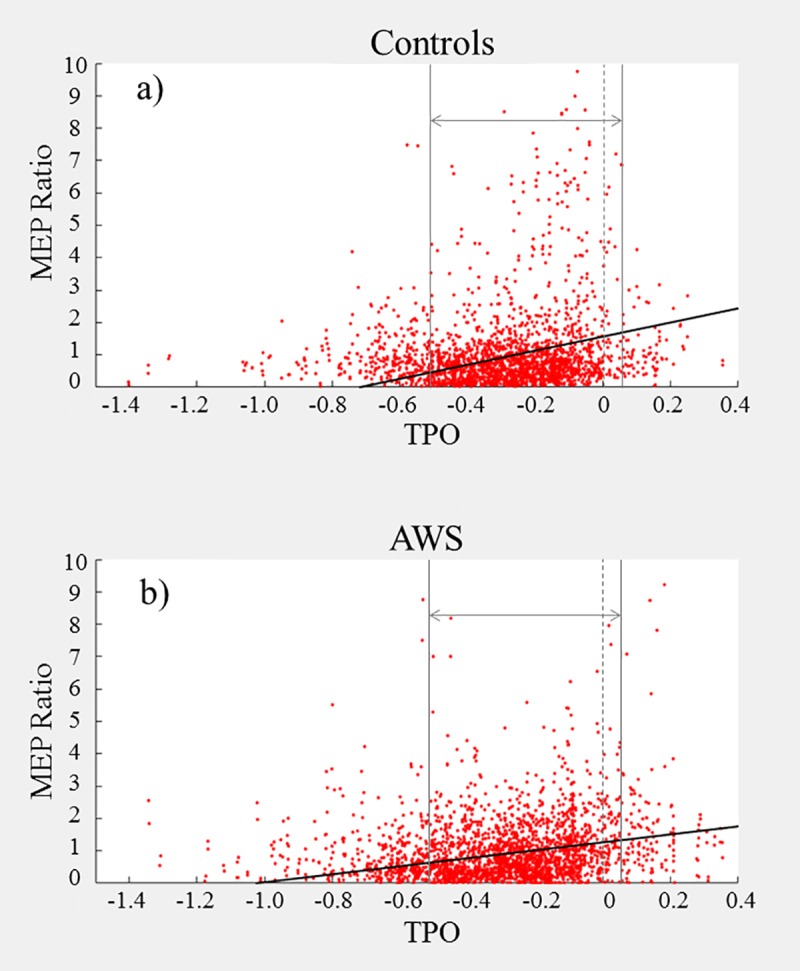
Fig 7.

a-b. Experiment 2 Pulse Interval–MEP Peak to Peak Amplitude relative to prefix onset for Controls (a) and AWS (b). Each point represents one trial. Prefix onset for each trial is marked by the dashed vertical bar at TPO = 0. The outer vertical bars denote the 500ms time window chosen for analysis. The diagonal line represents the linear regression predicted by the model applied within the selected window.
