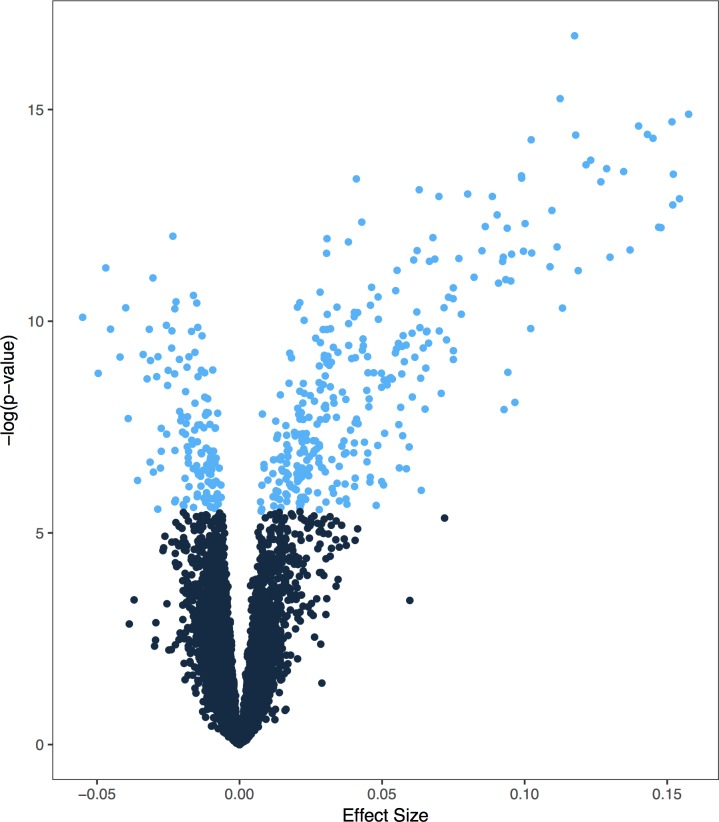
Fig 1. Transcriptome-wide distribution of transcripts that change over pregnancy.
Volcano plot depicting associations with gene transcripts that change over pregnancy. The x-axis represents the effect size. The y-axis represents the significance level for each test. Light blue points represent experiment-wide significance.

