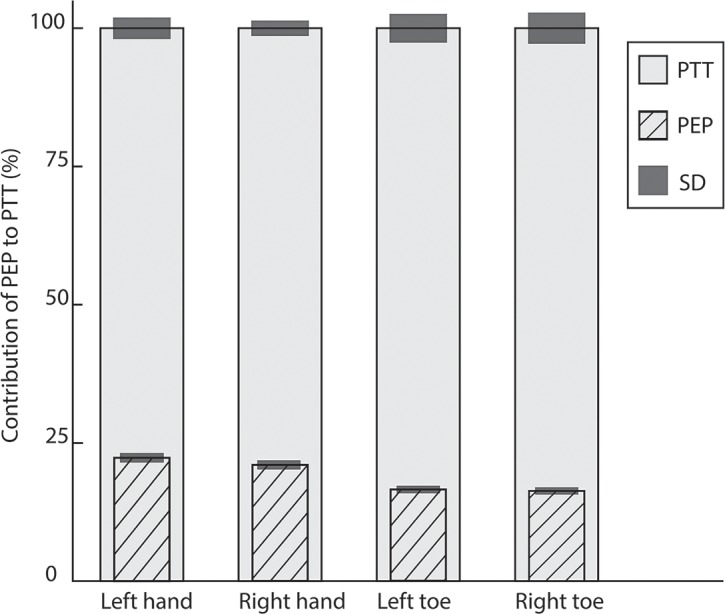
Fig 3. Contribution of the PEP (mean and SD) to the PTT for each sensor of group 1 (control group aged <50 years).

All values are normalized to a percentage (%) of the mean PTT (which is 100%) of the specific sensor. PTTMean% of left hand (n = 19) 100%±3.1%, PTTMean% of right hand (n = 20): 100%±2.4% (p = 0.004). Contribution of PEPMean% for PTT of left versus right hand 22.2%±1.3% versus 21.0%±1.3%. PTTMean% of left big toe (n = 18) 100%±4.7%, PTTMean% right big toe (n = 17) 100%±4.8%. Contribution of PEPMean% for left big toe versus right big toe 16.5%±1.0% versus 16.3%±1.0%.
