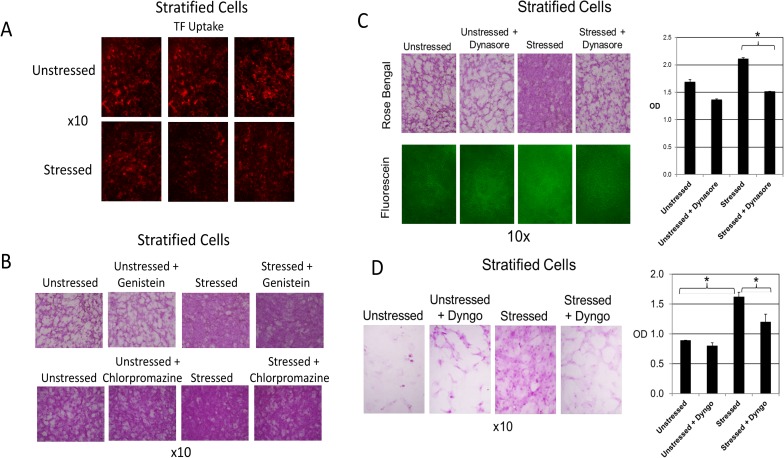
Fig 3. Only Dynasore and its analogue Dyngo-4a block oxidative stress-stimulated vital dye uptake in stratified cells.
A) HCLE stratified cultures plated in triplicate were either left unstressed or stressed with 10 mM tBHP. Alexa Fluor 568-conjugated TF, internalization of which is a marker of the endocytic process, was added to all cultures at the beginning of an experiment. Images are shown for each triplicate set.B) HCLE stratified cultures plated in triplicate were either left unstressed or stressed with 10 mM tBHP. At the same time, a set of unstressed and stressed cultures were treated with Genistein (200 uM). (An equal volume of the Dynasore diluent, DMSO, was added to untreated cultures.) After 2 hours, cultures were stained with rose bengal. A similar experiment was done using Chlorpromazine (8 ug/mL). Representative images are shown from each triplicate set.C) HCLE stratified cultures plated in triplicate were either left unstressed or stressed with 10 mM tBHP. At the same time, a parallel set of unstressed and stressed cultures were treated with Dynasore (40 uM). (An equal volume of the Dynasore diluent, DMSO, was added to untreated cultures.) After 3 hours, cultures were stained with fluorescein or rose bengal and imaged under epifluorescent illumination (fluorescein) or white light (rose bengal). Representative images are shown from each triplicate set. Quantification of rose bengal staining was performed: *, p<0.01 (student t-test, n = 3). OD = optical density at 562 nm.D) HCLE stratified cultures plated in triplicate were either left unstressed or stressed with 10 mM tBHP. At the same time, a set of unstressed and stressed cultures were treated with Dyngo-4a (15 uM). (An equal volume of the Dynasore diluent, DMSO, was added to untreated cultures.) After 3 hours, parallel sets of cultures were stained with fluorescein or rose bengal and imaged under epifluorescent illumination (fluorescein) or white light (rose bengal). Representative images are shown from each triplicate set. Quantification of rose bengal staining was performed: *, p<0.01(student t-test, n = 3).

