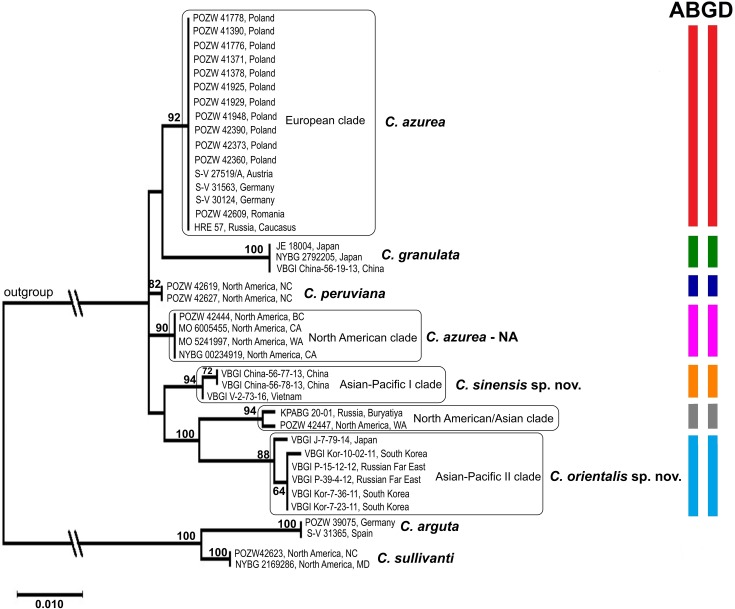
Fig 4. Maximum likelihood consensus tree of the Calypogeia azurea complex based on nuclear ITS2 sequences.
The results of the ABGD analysis represented by colored stripes on the right side of the diagram. The first bar of the diagram represents the initial partition, and the second bar represents the recursive partition. Only the accessions containing the sequences of all loci were included in the analysis. The related taxa (C. peruviana, C. granulata, C. tosana) were used for comparison. Calypogeia arguta and C. sullivantii were used as an outgroup. Bootstrap values are given above the branches.

