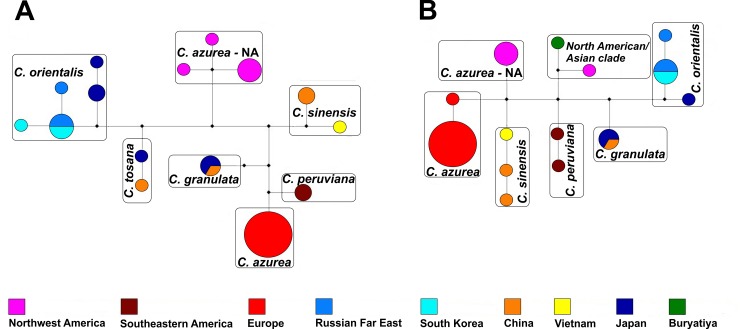
Fig 5.
A haplotype network of the Calypogeia azurea complex and the related taxa based on combined plastid (A) and ITS2 (B) data. Colored circles represent the geographic origin of the haplotypes. Diameters denote the number of specimens carrying a particular haplotype, where the smallest circle represents a single individual, and the largest circle represents 16 individuals. Black squares represent median vectors.

