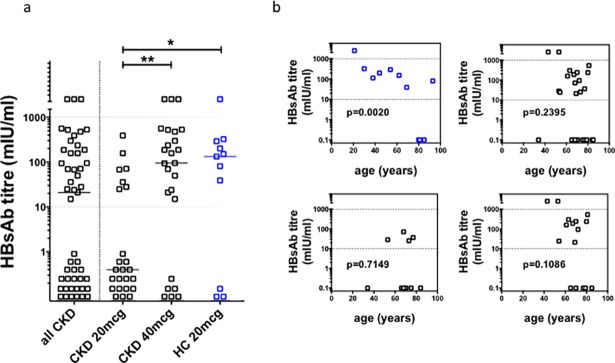
Fig 3. Post–vaccination HBsAb titers.
(a). Post-vaccination HBsAb titer for patients (CKD, black symbols; n = 49) and healthy controls (HC; blue symbols, n = 11) who completed primary hepatitis B vaccination schedule. Horizontal dotted line represents working range of serological assay. Horizontal bars indicate medians. Statistical analyses performed using Mann-Whitney U test; *p = 0.0498; **p = 0.0028. Bonferroni correction for α<0.05, p<0.03. (b). Rank correlation analysis (Spearman’s test) of age and post vaccination HBsAb titer in healthy controls (n = 11) and CKD patients (n = 49), for both 20mcg CKD group (n = 24) and 40mcg CKD group (n = 25).

