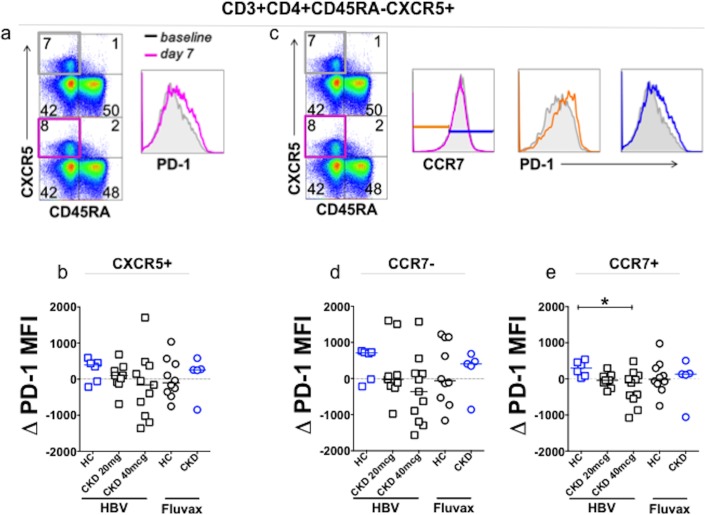
Fig 5. Vaccine induced change in PD-1 expression on CXCR5+ cTFH, and CCR7+ and CCR7- cTFH.
(a). Gating strategy to determine PD-1 MFI on CXCR5+ memory CD4+ T cells before and after vaccination. (b). Change in PD-1 MFI on CXCR5+ memory CD4+ T cells after vaccination according to vaccine group. (c). Gating strategy to determine PD-1 MFI according to CCR7 expression in CXCR5+ memory CD4+ T cells. Baseline, grey; Day 7, cerise; CCR7-, d7, orange; CCR7+ d7, blue. (d-e). Vaccine-induced change in PD-1 MFI on (d) CCR7- and (e) CCR7+ compartments according to vaccine group. CKD, HBV (blue squares, 20mcg n = 9, 40mcg n = 11); HC, HBV (n = 6, blue circles); CKD, Fluvax (blue circles, n = 5); HC, Fluvax (black circles, n = 10). Analysis performed using Mann-Whitney U test, horizontal bars represent medians; *p = 0.0120, Bonferroni correction for α<0.05, p<0.025.

