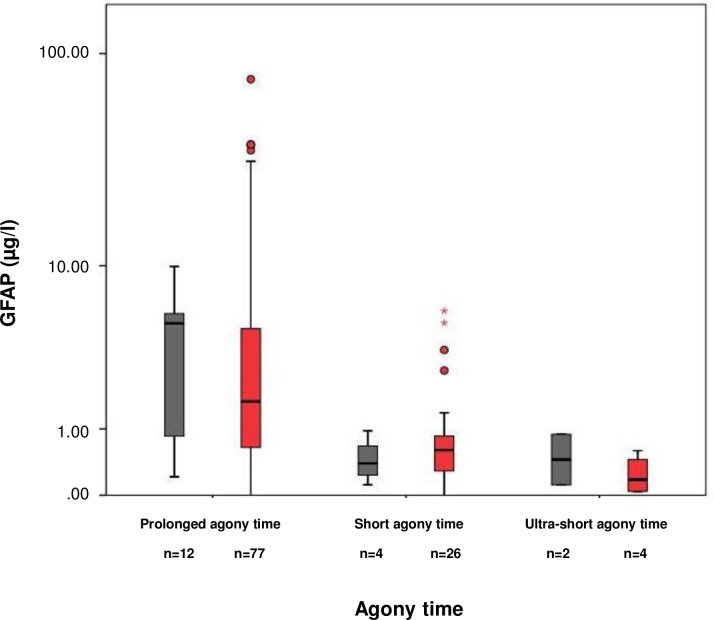
Fig 2. Post-mortem GFAP serum concentrations of the primary cerebral and the primary non-cerebral cause of death group stratified according to agony time.
GFAP concentrations of the cerebral cause of death group (grey bars): ultra-short agony times (median 0.53 μg/l [minimum 0.12, maximum 0.89]; n = 2), short agony times (0.39 μg/l [IQR 0.65, 0.12, 0.96]; n = 4), and prolonged agony times (5.02 μg/l [5.26, 0.21, 9.91], n = 12; Kruskal Wallis p = 0.003; post-hoc ultra-short versus prolonged agony times p = 0.051, short versus prolonged agony p = 0.043). GFAP concentrations of the non-cerebral cause of death group (red bars): ultra-short agony times (median 0.19 μg/l [IQR 0.49 minimum 0.03, maximum 0.59]; n = 4), short agony times (0.60 μg/l [0.57, 0.00, 5.87]; n = 26), and prolonged agony times (1.66 μg/l [4.21, 0.28, 76.25], n = 77; Kruskal Wallis p<0.001; post-hoc ultra-short versus prolonged agony times p = 0.009, short versus prolonged agony p<0.001).

