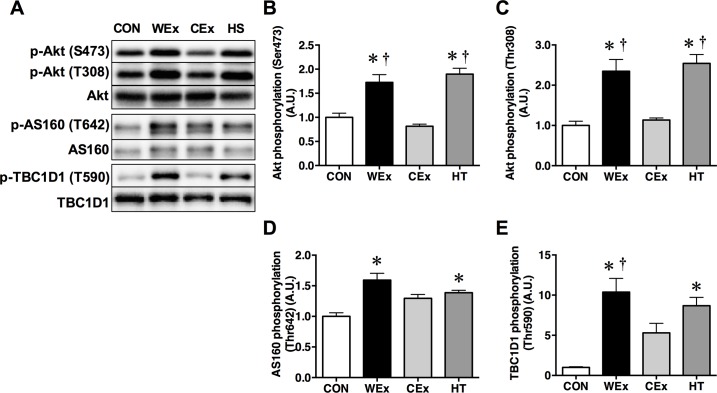
Fig 3.
Representative western blots (A) and the phosphorylation ratio of Akt at Ser473 and Thr308 (B and C), AS160 at Thr642 (D), and TBC1D1 at Thr590 (E) in the gastrocnemius muscle after a single bout of exercise and heat treatment. CON, n = 6 (white bar); WEx, n = 7 (black bar); CEx, n = 7 (gray bar); HT, n = 6 (dark gray bar). Values are shown as the means ± SE. *p < 0.05 vs. CON, †p < 0.05 vs. CEx.

