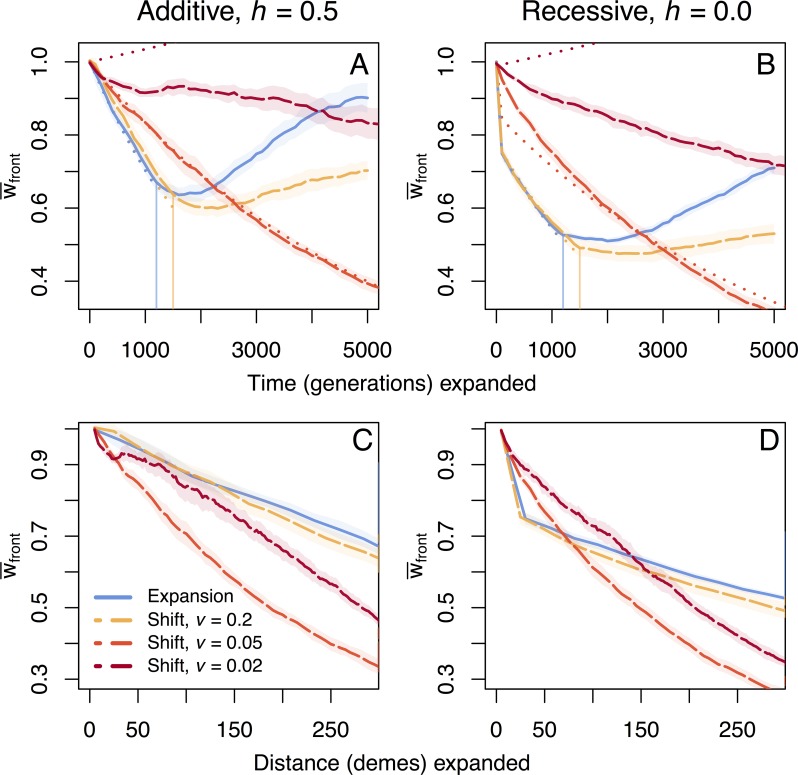
Fig 1. Fitness loss per time and space under soft selection.
Trajectories of mean fitness loss for additive and recessive mutation models over time (panels A and B) and space (panels C and D) at the expanding front under soft selection show more overall fitness loss for range shifts. Vertical lines indicate when the population reaches the end of the 1x300 deme landscape and expansion is complete. Shaded regions show two standard errors calculated over ten replicate simulations. The fastest shift (v = 0.2) expands at a speed closest to the full expansion, and is compared to two slower speed shifts (v = 0.05, 0.02). The full timescale for the two slower shifts reaching the end of the landscape is shown in Supplemental S12 Fig. Analytic solutions for fitness loss over time are shown as dotted lines in panels A and B, where evolution of mean fitness is given by Eq (1) with F = K m /2, where K is the (diploid) carrying capacity of a deme. The accumulation of fixed deleterious and fixed beneficial mutations for these cases can be seen in Supplemental S1 Fig.

