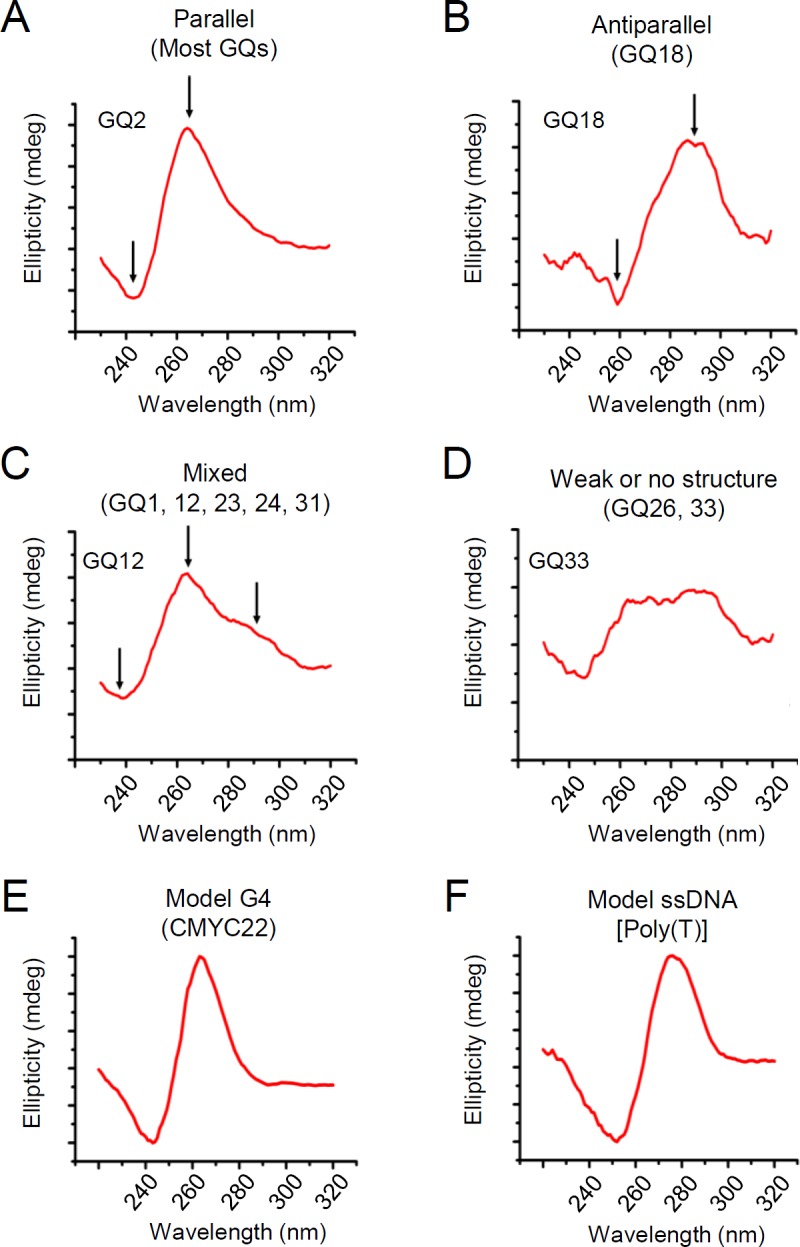
Fig 3. The CD spectra of the representative HCMV G4 oligonucleotides.

(A to D) CD spectra of GQ2 (A), GQ18 (B), GQ12 (C), and GQ33 (D) represent the parallel, antiparallel, mixed, and weak G4 sequences, respectively. A parallel G4 (GQ2) showed a peak at 260 nm and a trough at 240 nm (A), whereas an antiparallel G4 (GQ18) was characterized by a peak at 290 nm and trough at 260 nm (B). GQ12 showed a mixed structure with a shoulder around the 290 nm region in addition to the parallel G4 peaks (C). In a weak G4 (GQ33), a broad shoulder was observed around the 230–280 nm region (D). (E and F) CD spectra of the control oligonucleotides. CD spectra of a G4-forming oligonucleotide from the promoter region of C-MYC (CMYC22) (as a positive control) (E) and a single-stranded 24mer-poly(T) [Poly(T)] (as a negative control) (F) are shown.
