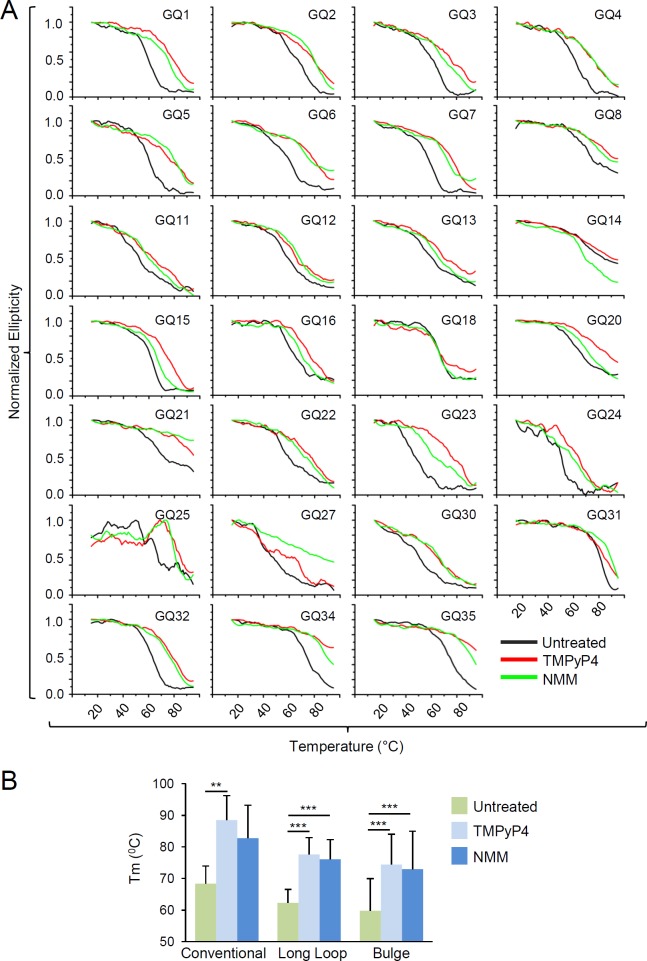
Fig 4. CD melting temperature (Tm) graph of HCMV G4 oligonucleotides in the absence and presence of G4 stabilizer TMPyP4 and NMM.
(A) Comparison of CD Tm spectra of HCMV G4-forming oligonucleotides in the presence of G4 ligands, NMM and TMPyP4. Fifteen μM DNA oligos were annealed in the presence of 10 mM Tris-HCl [pH 7.5] and 100 mM KCl buffer with or without 30 μM TMPyP4 and NMM (DNA to chemical ratio 1:2). CD melting graph was calculated at 290 nm wavelength for GQ18 and at 262 nm for rest of the G4s. The data were normalized using the maximum ellipticity and smoothed using 12-point Savitzky-Golay algorithm. Note that the data of 27 GQs, which showed melting curves within the temperature range indicated, are shown. (B) Comparison between mean CD melting temperatures of each type of G4s in the absence or presence of TMPyP4 and NMM.

