Fig. 2.
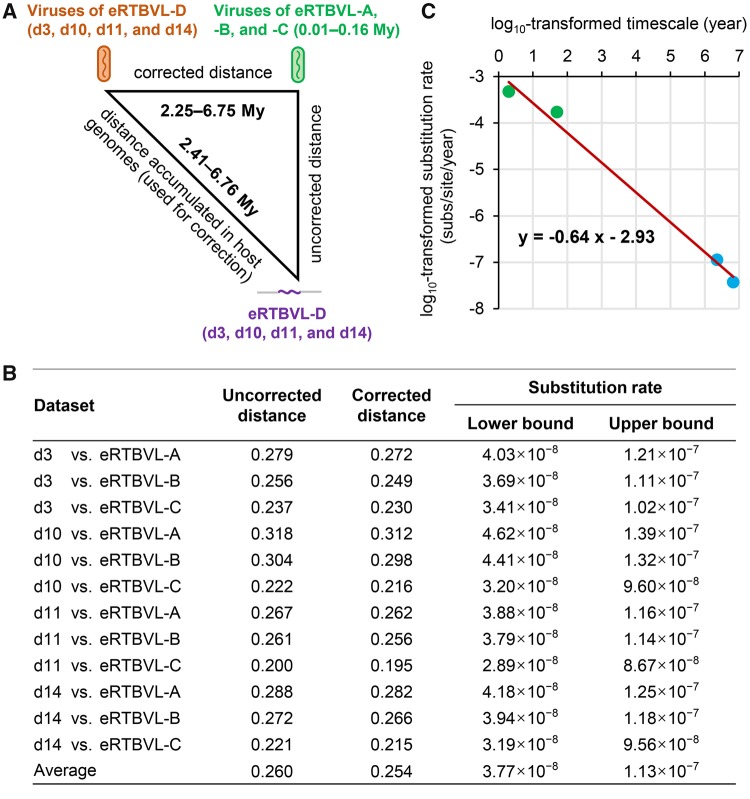
—Long-term substitution rates of plant pararetroviruses (PRVs) estimated with eRTBVL-D. (A) Strategy used to estimate genetic distances for substitution rate calculations. The distance between an eRTBVL-D sequence in the rice genome and viral sequences of eRTBVL-A/-B/-C (uncorrected distance) minus the distance accumulated in the rice genome from 2.41 to 6.76 Myr for eRTBVL-D was considered to approximate the distance between the viruses of eRTBVL-D and eRTBVL-A/-B/-C from 2.25 to 6.75 Myr (corrected distance). Each element is represented by a different color. The (unknown) amount of time required for a viral sequence to be endogenized in a host population was ignored because it was ∼0 relative to a million years of macroevolution. Therefore, the divergence time between the viral sequences of the studied eRTBVL-D and eRTBVL-A/-B/-C segments was approximated as the difference between the ages of eRTBVL-D and eRTBVL-A/-B/-C sequences. (B) Long-term substitution rates of PRVs calculated using corrected distances. (C) Time-dependent rate phenomenon of PRVs. The plot presents the relationship between substitution rates (substitutions/site/year) and the corresponding measurement time scales (years). The log10-transformed values underwent a linear regression analysis (red line), and the resulting equation is displayed. The data are from previous studies (short-term; green dots) (Yasaka et al. 2014; Guimarães et al. 2015) and from this study (long-term; blue dots). One value from Yasaka et al. (2014) that was calculated only from divergent gene regions was not included.

