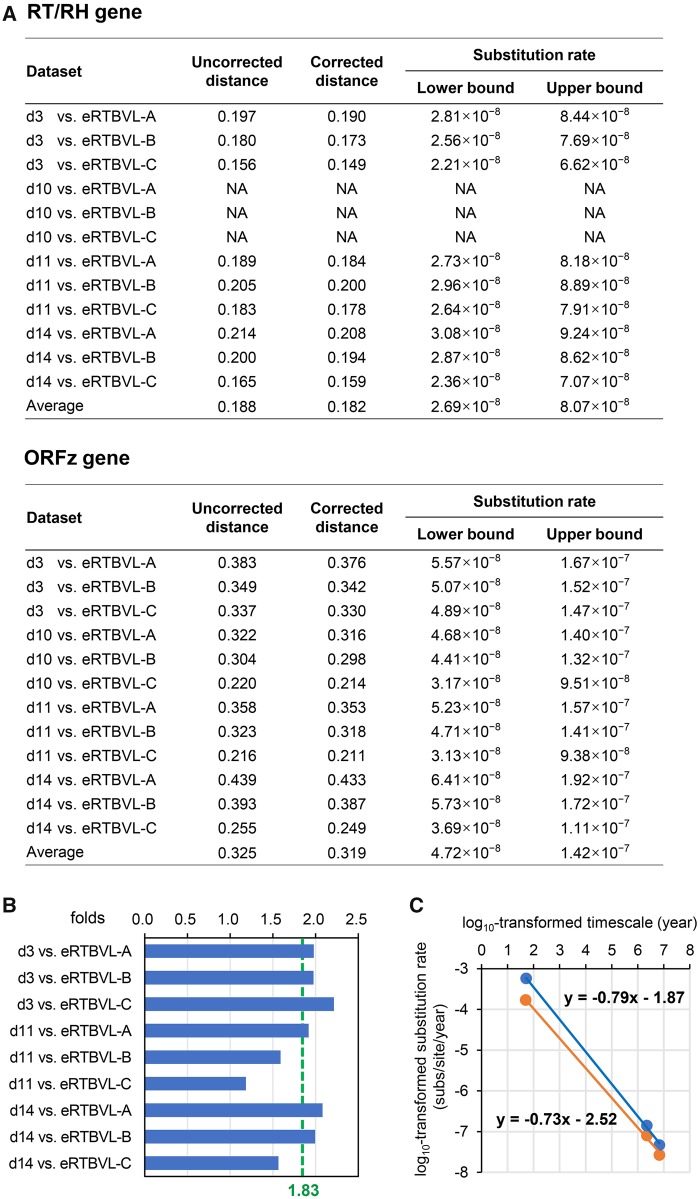
Fig. 3.
—Long-term GRH between the conserved RT/RH and divergent ORFz genes of PRVs. (A) Long-term substitution rates of the RT/RH and ORFz genes of PRVs. Substitution rates were calculated using corrected distances. NA, not available. (B) Quantification of the long-term GRH between these two genes. GRH values (fold difference) are displayed on the plots, with green dotted lines indicating the averages. (C) Comparison between the rate decay speed of the RT/RH and ORFz genes of PRVs. The plot presents the relationship between gene substitution rates (substitutions/site/year) and the corresponding measurement time scales (years). The log10-transformed values underwent a linear regression analysis (orange dots and line for the RT/RH gene, and blue dots and line for the ORFz gene), and the resulting equations are displayed. The short-term data are from a previous study (Yasaka et al. 2014). Note that the short-term substitution rate for the RT/RH gene in the analysis is actually an average value for ORFs I–V of CaMV (the RT/RH gene is located in ORF V), thus the slope for the RT/RH gene is >−0.73.

