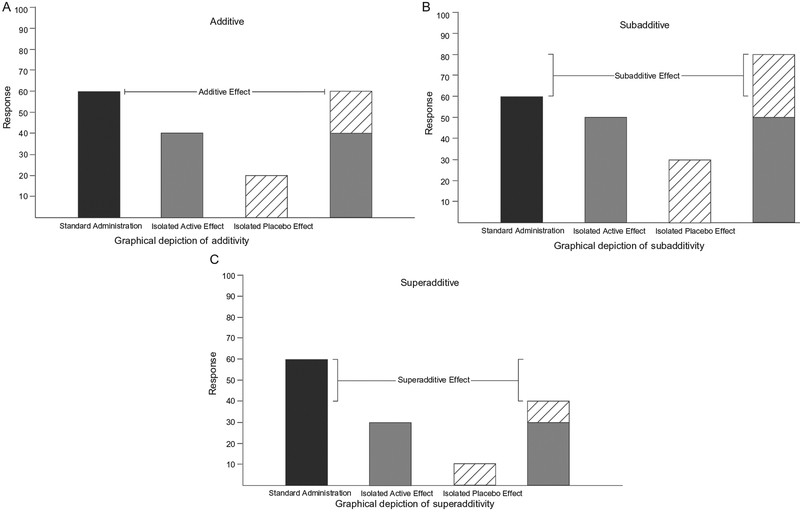
Fig. 2.
Graphical representations of (A) additive, (B) subadditive, and (C) superadditive outcomes. In these outcomes, the first column indicates treatment efficacy when administered under normal circumstances (i.e., an active treatment is administered with the full awareness of the recipient). In contrast, the following two columns depict the isolated active treatment and placebo effects and the fourth column their summed total.

