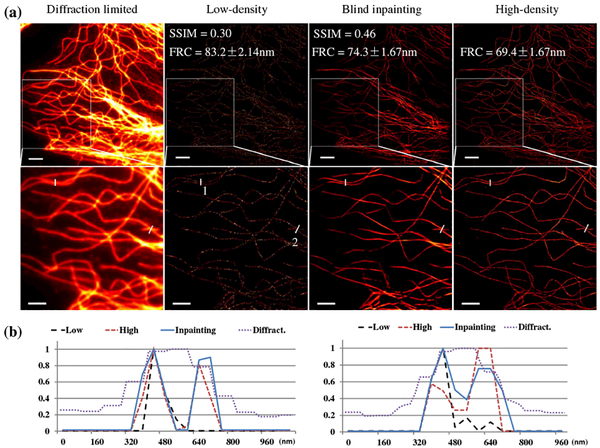
Fig. 5.
Results from real microtubule STORM data. (a) Images of the full field of view (top) and a selected region of interest (ROI, bottom). From left to right: diffraction-limited image, low-density STORM image using 400 frames, blind inpainting reconstruction from the 400 frame image, and high-density STORM image taken using 34,000 frames, respectively. Scale bars: 2.5 μm. Pixel size: 53 nm. (b) Line profiles of two segments indicated by the white lines in (a), left for segment 1 and right for segment2. Low: low-density image. High: high-density image. Inpainting: blind inpainting reconstruction. Diffract.: diffraction-limited image.

