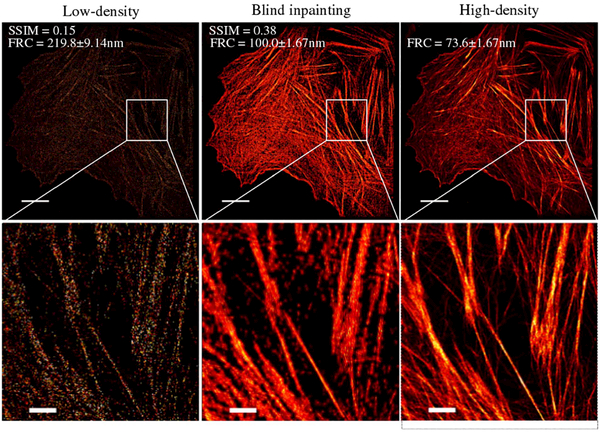
Fig. 8.
Results from real actin STORM data showing images of the full field of view (top) and selected ROI (bottom). See Fig. S6 in Supplement 1 for other ROIs. From left to right: low-density STORM image using 1000 frames, blind inpainting reconstruction from the 1000 frame image, and high-density STORM image using 115,000 frames, respectively. Scale bars: 1.25 μm. Pixel size: 35 nm.

