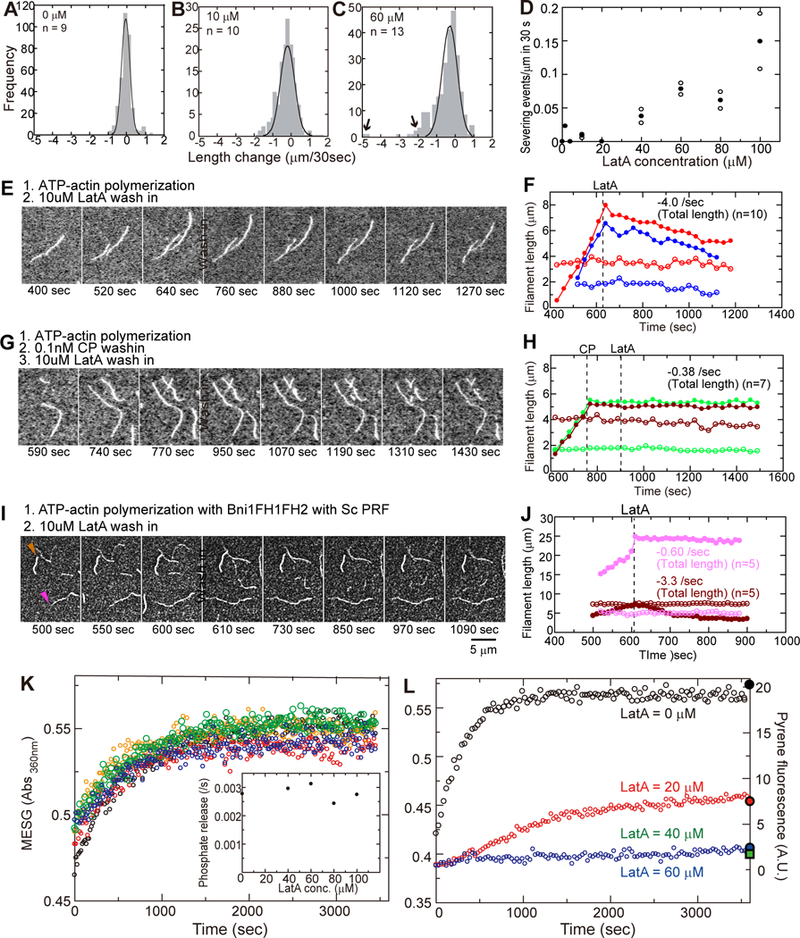
Figure 3. Effects of LatA on actin filament severing and influence of actin filament capping and Pi release on depolymerization.

(A-C) Histograms of the frequencies of length changes at barbed ends during 30 s intervals with a range of concentrations of LatA. Large negative length changes outside the Gaussian distributions were due to severing (C, arrows). (D) Dependence of the severing rate on the concentration of LatA. () Severing rates in two or three independent experiments at each concentration of LatA with 7–20 actin filaments in the observation fields. (●) Average severing rates. (E, G, I) Time series (time at the bottom of each panel) of TIRF micrographs during assembly and disassembly of actin filaments. At time zero 1 μM Mg-ATP-actin (20% Oregon green labeled) was mixed with the polymerization buffer, loaded into the flow cell and observed to identify rapidly growing barbed ends and slowly growing pointed ends. At the times indicated by “wash in” the solution in the chamber was changed. (F, H, J) Time courses of filament lengths from a fiducial mark to barbed (filled) and pointed-ends (open) of 2 typical actin filaments (color coordinated). (E, F) Polymerization of 1 μM Mg-ATP-actin (20% Oregon green labeled) alone. At the indicated times, free actin was washed from the chamber with polymerization buffer containing 10 μM LatA. (G, H) At the left dashed line in (H) free actin was washed from the chamber with polymerization buffer and replaced with 0.1 μM capping protein (CP) in polymerization buffer. After incubating for 2 min, 10 μM LatA was loaded in the chamber at the right dashed line. (I, J) A mixture of 0.5 μM Mg-ATP-actin (20% Oregon green labeled), 5 nM formin (Bni1FH1FH2) and 1 μM Sc profilin in polymerization buffer was loaded into the observation chamber. At the time indicated by the dashed line in (J), free actin monomers, formins and profilin were washed from the chamber with polymerization buffer containing 10 μM LatA. Formin-bound filaments (barbed end marked with a pink arrowhead) are dimmer than filaments with free barbed ends (barbed end marked with a brown arrowhead). Colors in (J) are coordinated with (I). (K) Time course of the release of phosphate from filaments rapidly polymerized from unlabeled 40 μM Mg-ATP-actin in 2 min and then diluted at time zero to 20 μM into polymerization buffer with a range of concentrations of LatA: 0 (black); 40 μM (red); 60 μM (orange); 80 μM (green); and 100 μM (blue). (Inset) Observed rate constants for the release of phosphate vs. LatA concentration. (L) Time course of the release of phosphate during the polymerization of 20 μM Mg-ATPactin followed by the absorbance of MESG at 360 nm. Colors indicate the micromolar concentrations of LatA: 0 (black); 20 (red); 40 (green); and 60 (blue). The filled symbols on the right Y-axis are the fluorescence of pyrenyl-actin (5% label) measured after 1 h of polymerization. See also STAR Methods.
