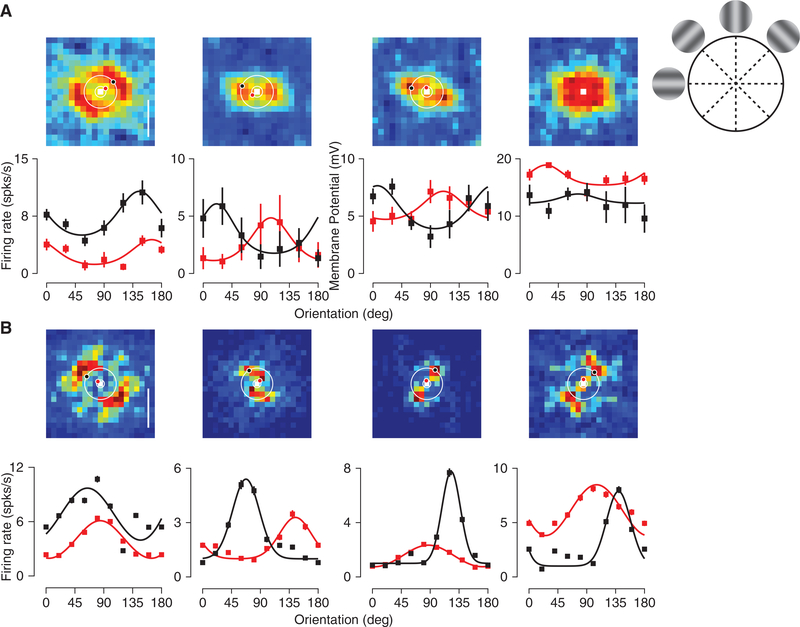
Figure 6. Neuron Receptive Fields in the Frequency Domain Are Intricate.
(A) Mean membrane potential responses to Hartley stimuli (see STAR Methods) are plotted for combinations of horizontal and vertical spatial frequencies (top row). Circles indicate stimulus combinations corresponding to oriented gratings at fixed spatial frequencies. The red and black dots indicate the peak response at those spatial frequencies. Each panel corresponds to a different example cell. Orientation tuning curves for drifting gratings at 0.014 cyc/deg (red) and 0.044 cyc/deg (black) are shown for these four neurons (bottom row). Error bars represent SEM.
(B)Example frequency receptive fields for four neurons in the model. Orientation tuning curves at 0.01 cyc/deg (red) and 0.04 cyc/deg (black) are shown for these neurons (bottom row) based on responses to drifting gratings.

