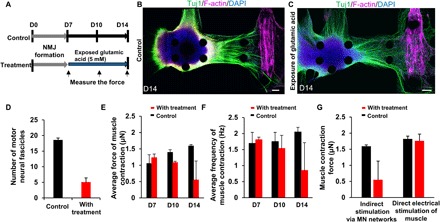
Fig. 4. Excitotoxicity of the 3D human motor unit model induced by excess glutamic acid treatment.

(A) Time scale of glutamic acid treatment. After formation of the motor unit with NMJ by D7, glutamic acid (5 mM) treatment was started alongside the control. Muscle contraction was measured on D7, D10, and D14 by applying glutamic acid (0.1 mM). (B and C) Representative images of the 3D human motor unit on D14 with and without continuous treatment of glutamic acid. Glutamic acid treatment caused loss of thick neural fibers. Scale bars, 100 μm. (D) Number of motor neural fascicles with glutamic acid treatment at D14 is less than that of control. n = 2. (E) The average force of muscle contraction with treatment slightly decreased on D10 and significantly decreased after D14 although contraction force of control consistently increased over time. n = 2. (F) Average frequency of muscle contractions also decreased with treatment over time. Average contraction force fell from ~1.3 to 0.5 μN, and frequency was also reduced from 1.8 to 0.7 Hz. n = 2. (G) Difference of muscle contraction force between chemical and electrical stimulation. Electrical stimulation produced higher muscle contractility compared to treatment of glutamic acid via MN activity. n = 2. Error bars ± SD.
