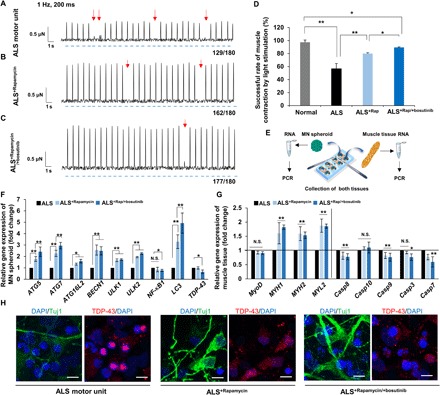
Fig. 6. Muscle contraction by optical stimulation with rapamycin and bosutinib and expression of autophagy.

(A to C) Muscle contraction force by optical stimulation without drugs and with rapamycin and cotreatment of rapamycin and bosutinib. Red arrows indicate the absence of muscle contraction with light stimulation. Blue dashed lines indicate times of light stimulation. (D) Successful rate of muscle contraction by light stimulation in three cases. The ALS motor unit often misses muscle contraction (~56%), whereas drug treatments returned the success rate of muscle to nearly normal; n = 6. ALS, ALS+Rap, ALS+Rap/+bosutinib ; n = 4. (E) To measure gene expression after coculture in the device, two tissues were collected separately and then total RNA was purified. (F) Gene expression change of the MN spheroid after D14 of culture. ATG5, ATG7, ATG16L2, BECN1, ULK1, ULK2, and LC3 regulating autophagy increased by the addition of rapamycin and bosutinib, while expression of TDP-43 decreased. n = 4. (G) Changes in gene expression related to the myogenesis and apoptosis of muscle tissue after D14 of culture with drug treatment. n = 4. (H) TDP-43 turnover in MN in the microfluidic devices after 14 days of culture. In the presence of drugs, the aggregation of TDP-43 was somewhat suppressed. Scale bars, 20 μm. *P < 0.05; **P < 0.01, two-way ANOVA. Error bars ± SD.
