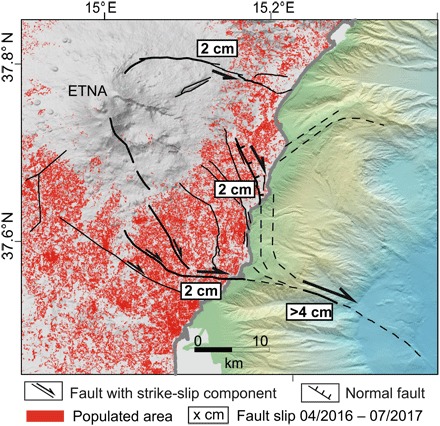
Fig. 4. Shoreline-crossing fault slip representation of Mount Etna’s southeastern flank movement.

Populated areas are obtained from a Landsat-8 classification on a 30 m by 30 m grid (Landsat-8 image courtesy of the U.S. Geological Survey). Bold lines represent main active features during the observation period.
