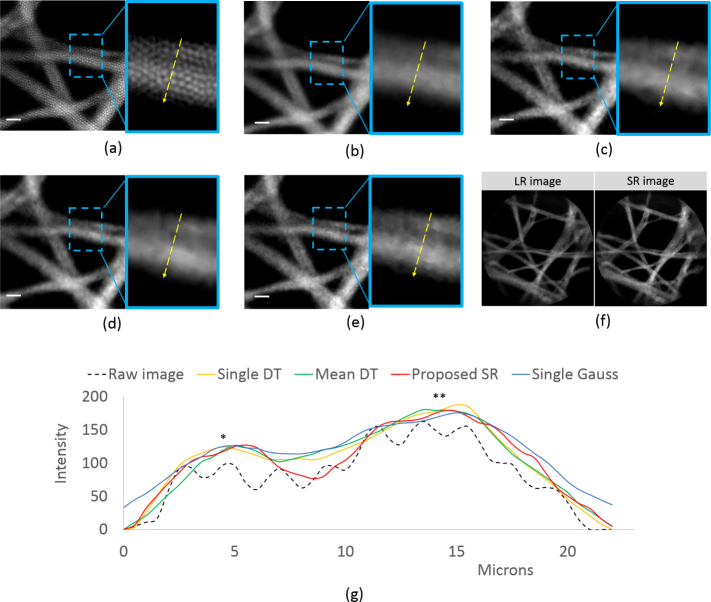
Fig. 6.
Results from imaging lens tissue paper using four images with a 2×2 square shift pattern, showing (a) single raw acquired LR image, (b) reconstruction by Gaussian smoothing on a single LR image, (c) reconstruction by DT algorithm on a single LR image, (d) reconstruction by DT algorithm on the average of 4 shifted LR images, (e) reconstruction using the proposed SR method and (f) un-cropped images of single LR frame and SR image reconstructed using the proposed method. For (a)–(e), images are cropped to 233×233 pixels for better visualization. Zoomed insets (3.1X magnification) correspond to a small area where two lens paper fibers overlap. (g) Plot of pixel intensity along a line segment shown on the insets. Image contrast values are calculated at *peak-1 and **peak-2. The scale bar is 10 µm.

