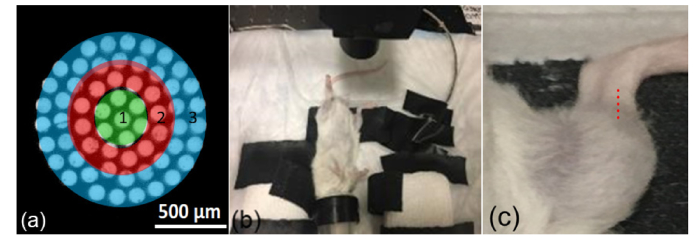
Fig. 1.
(a) Schematic of collection fiber images at the tissue surface, with ring 3 being the outermost zone. (b) Setup for live mouse measurement, with focusing/collecting lens above the right tibia and nose cone for anesthesia. (c) Zoomed in view with Raman sampling locations above the tibia indicated by overlaid red dots.

