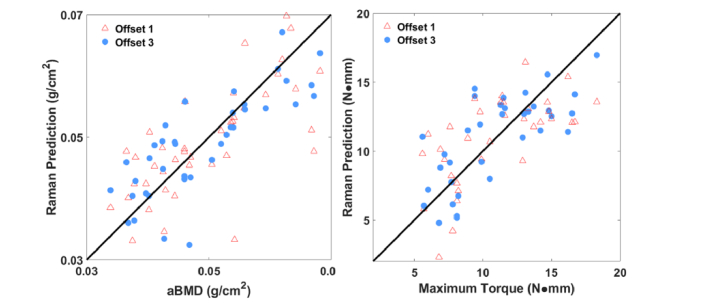
Fig. 8.
(a) Correlation between predicted aBMD based on PLSR of Raman spectra from ring 1 (marked by red triangles) compared with ring 3 (marked with blue circles) measured transcutaneously on live mice and that of the reference obtained by DXA. Correlation coefficients were similar for the two offsets. (b) Correlation between predicted MT based on PLSR of Raman spectra from ring 1 (marked by red triangles) compared with ring 3 (marked with blue circles) measured transcutaneously on live mice and that of the reference obtained by torsion test. In this case, the correlation was noticeably stronger for the larger offset (r2 = 0.53 versus 0.19).

