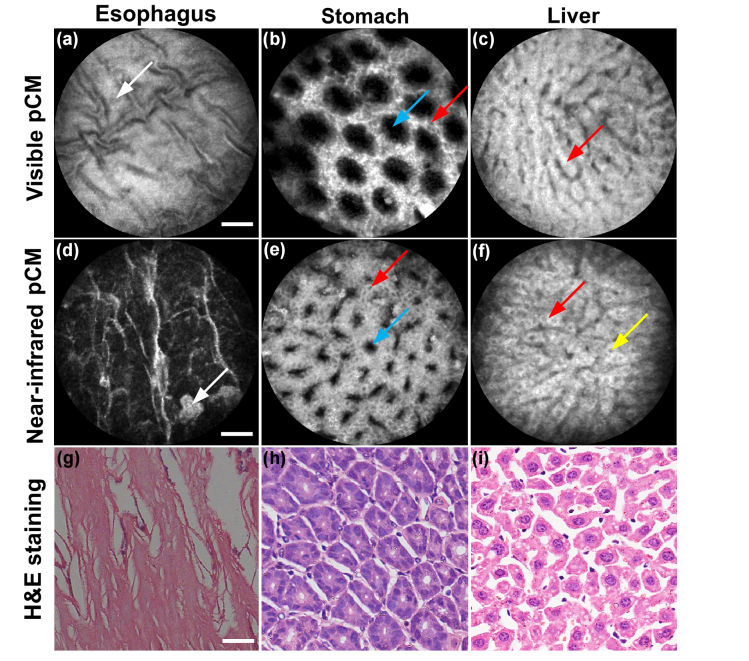
Fig. 9.
Images of various tissues by visible pCM and near-infrared pCM. (a-c) and (d-f) show the images obtained by 488 nm excitation and 785 nm excitation, respectively. (a) and (d) are images of the esophagus. White arrows show the squamous epithelium. (b) and (e) are images of the stomach. Red arrows indicate superficial epithelial cells and blue arrows indicate gastric pits. (c) and (f) show images of the liver. Red arrows indicate the sinusoidal architecture of the liver and yellow arrow indicates the nucleus of the hepatocyte. (g-i) Corresponding histologic specimens. Scale bars: 50 μm.

