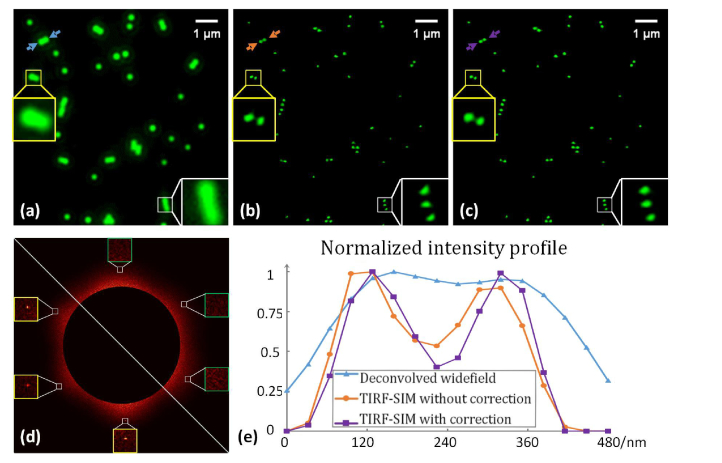
Fig. 4.
Experimental results: (a) the filtered widefield results, (b) the reconstructed results without correction, and (c) the results with phase correction via the inverse matrix based method (note the brightness was increased by 40% to improve the visibility). (d) The phase-only correlation results of the reconstructed image. Lower left: without correction, and upper right: with correction. The intensity profile along the cutline indicated by the arrows in (a)–(c) is shown in (e) using the results without brightness enhancement.

