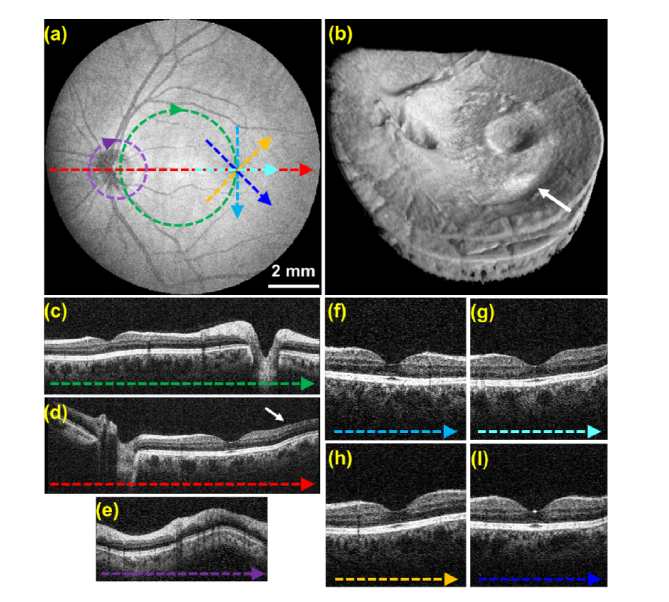
Fig. 8.
Retinal OCT volume acquired using constant linear velocity spiral scanning and isotropic transverse sampling in 0.4 seconds (protocol #2 in Table 1) from a healthy subject. (a) SVP generated from the OCT volume. Dashed colored lines correspond to the locations of the circular and linear B-scans shown in (c-i). (b) OCT volume render. (c-i) Un-averaged linear and circular B-scans extracted from the volumetric data set. White arrows denote artifacts likely due to fixational eye motion.

