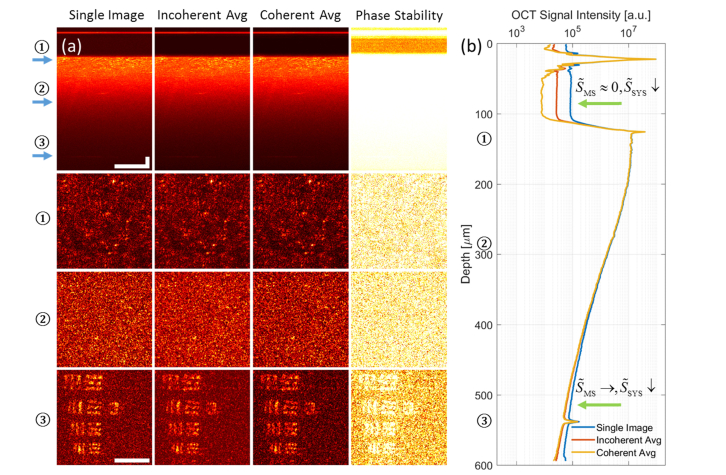
Fig. 5.
Single-state control experiment for AD-OCT, showing a USAF target hidden beneath a scattering layer with an optical thickness of 7.2 scattering MFP. (a) Comparison of cross section (first row, γ = 0.7) and en face (3 bottom rows) among single image, incoherent average, and coherent average, from 12 volumes with a single aberration state. The depth of each en face plane is indicated by the arrows in the cross section view. The last column shows the phase stability measurements for the single-state control. Scale bars indicate 40 μm for all images. The colormap has a fixed range at each depth for the first three columns, and from 0 to 1 for the last column. (b) Plot of OCT signal magnitude (99th percentile at each depth) versus depth for single image, incoherent average, and coherent average from 12 volumes with a single aberration state. The depths of the 3 en face planes in (a) are labelled on the axis. The upper green arrow indicates a region where the single-state control reduces the system noise floor by time averaging, and the bottom green arrow points to a region where the background cannot be reduced purely with time averaging.

