Fig. 6.
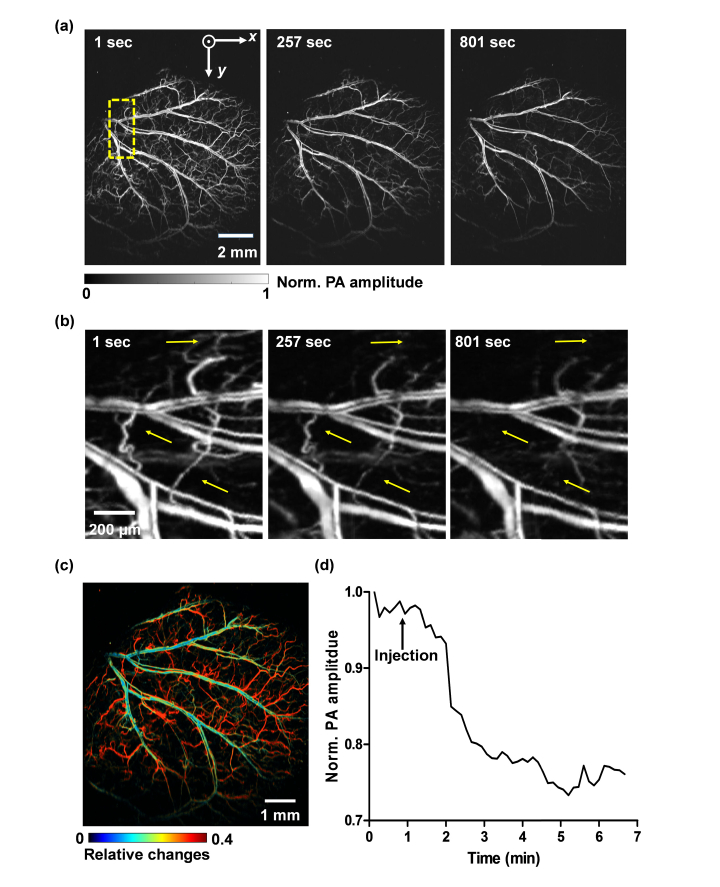
HM-OR-PAM of the drug responses in a mouse ear. (a) Representative vasculature images of the entire mouse ear at different time points after the epinephrine injection. (b) Close-up images of the region indicated by the dashed box in (a), showing the microvessel constriction (yellow arrows). (c) The relative change in PA signal amplitude before and after epinephrine injection, showing that the smaller vessels experienced stronger drug effect. (d) The time course of average PA signal amplitude over the entire mouse ear before and after the drug injection.

