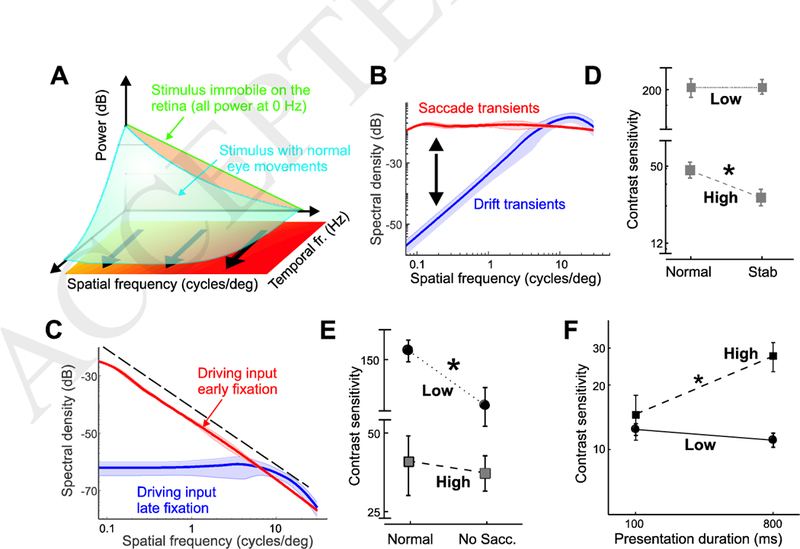
Figure 1. Space-time consequences of eye movements.

(A) Eye movements transform spatial patterns of luminance into temporal modulations impinging on the retina. In the frequency domain, this transformation redistributes the spatial power of the stimulus from 0 Hz (green line) across nonzero temporal frequencies (blue surface) in a way that depends on the type of eye movements. (B) Spatiotemporal power redistributions resulting from saccades (red curve) and fixational drifts (blue). Each curve represents the average fraction of stimulus power that eye movements make available at 10 Hz. (C) Spectral density of the retinal input during viewing of natural scenes. Data represent average distributions at 10 Hz. The power distributions made available by saccades and drift drive cell responses at different times during the course of post-saccadic fixation. (D-E) Drift and saccade transients contribute to different ranges of visual sensitivity. Elimination of drift and saccade transients (D) impairs contrast sensitivity at 10 cycles/deg (high), but has little effect at 1 cycle/deg (low). The opposite effect occurs with elimination of saccade transients (E). (F) Time course of visual sensitivity during natural post-saccadic fixation. Following a saccade, contrast sensitivity continues to improve at 10 cycles/deg but not at 1 cycle/deg. Data adapted from [58]. (*) indicates p<0.03.
