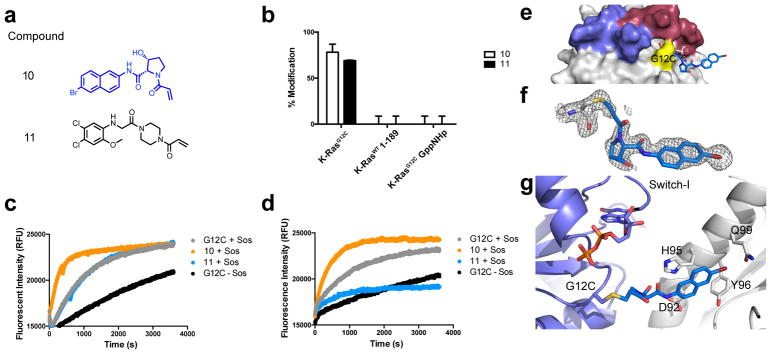
Figure 3.
a. Structures of compound 10 and switch-II inhibitor 11. b. Percentages represent adduct formation to K-Ras constructs with 25uM compound over 24h, 25°C. Sos-catalyzed exchange of apo and compound-labeled K-RasG12C GDP with c. BODIPY-FL GDP and d. BODIPY-FL GTP and fluorescence intensity was monitored over time. e. Co-crystal structure of 10 (blue) and K-RasG12C GDP (grey; PDB: 6ARK). f. Fo-Fc omit map (grey mesh, 2.0σ) of 10. g. Cartoon representation of p-loop (slate), Cys12, and 10 (blue) with indicated residues that make hydrophobic contacts with 10 in nearby symmetry mate (white).

