Figure 2.

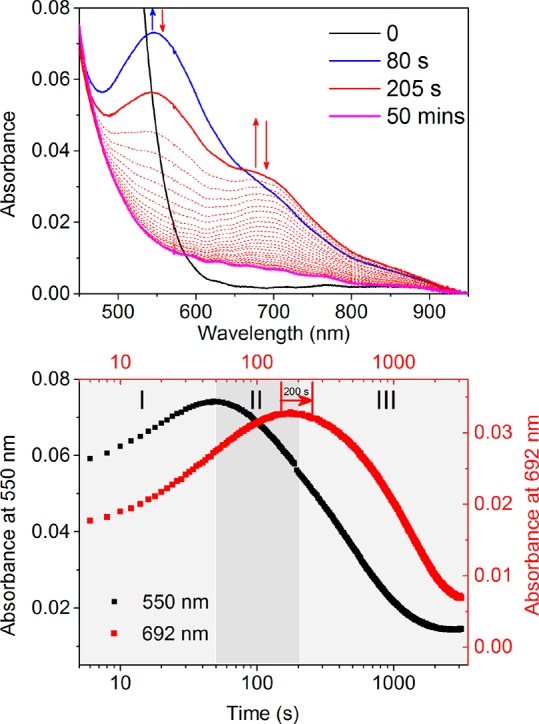
(top) UV–vis absorption spectrum of 2 (0.25 mM) in methanol before (black) and after addition of 2 equiv of H2O2 at 21 °C. (bottom) Corresponding change in absorbance over time at 550 and 692 nm. Path length: 2 cm.

(top) UV–vis absorption spectrum of 2 (0.25 mM) in methanol before (black) and after addition of 2 equiv of H2O2 at 21 °C. (bottom) Corresponding change in absorbance over time at 550 and 692 nm. Path length: 2 cm.