Figure 6.

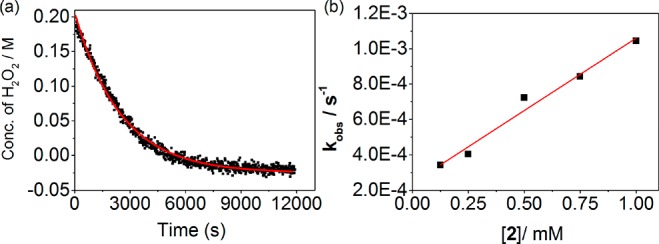
(a) Concentration of H2O2 with time following addition of H2O2 (200 mM) to 2 (0.25 mM) at 21 °C. (b) Plot of the pseudo-first-order rate kobs versus concentration of 2.

(a) Concentration of H2O2 with time following addition of H2O2 (200 mM) to 2 (0.25 mM) at 21 °C. (b) Plot of the pseudo-first-order rate kobs versus concentration of 2.