Figure 6.
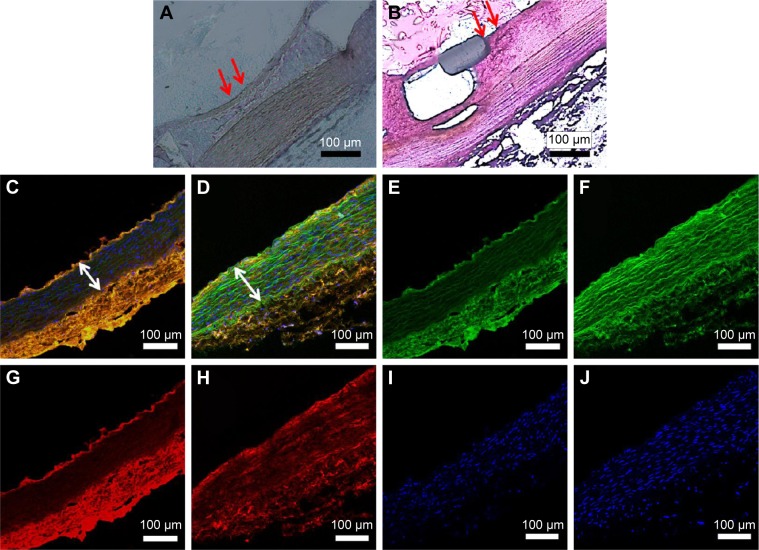
Pathological sections of arterial lesions in two groups, stained by hematoxylin-eosin and HES5 markers at 4 weeks following stent implantation.
Notes: (A) The ticagrelor group (red arrows) exhibited a more complete lining of endothelial cells than the sirolimus group (B, red arrows). Based on confocal fluorescence microscopy, the amount of formed neointima suggests that the proliferation of SMCs in the media was lower in the ticagrelor group (C and D: merged image, white double arrow). Autofluorescence was observed on the tunica media (E and F; green) and immunofluorescent labeling of HES5 (G and H; orange); a smooth muscle proliferation marker was noted close to the stented arteries, and observations were made using confocal fluorescence microscopy (C–J). The specimens were co-stained with DAPI to reveal cell nuclei (I–J).
Abbreviation: SMC, smooth muscle.

