Figure 1.

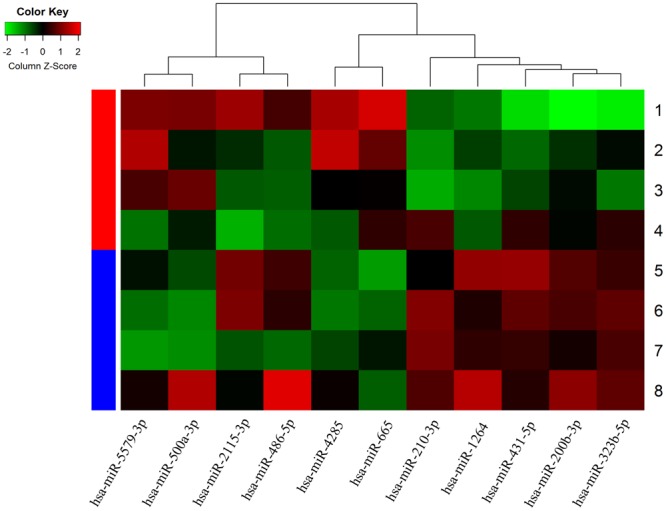
Hierarchical cluster analysis of 4 T2DM patients with CLI and 4 T2DM patients without CLI, based on differentially expressed miRNAs. Red indicates relative up-regulation, and green indicates relative down-regulation.

Hierarchical cluster analysis of 4 T2DM patients with CLI and 4 T2DM patients without CLI, based on differentially expressed miRNAs. Red indicates relative up-regulation, and green indicates relative down-regulation.