Fig. 1.
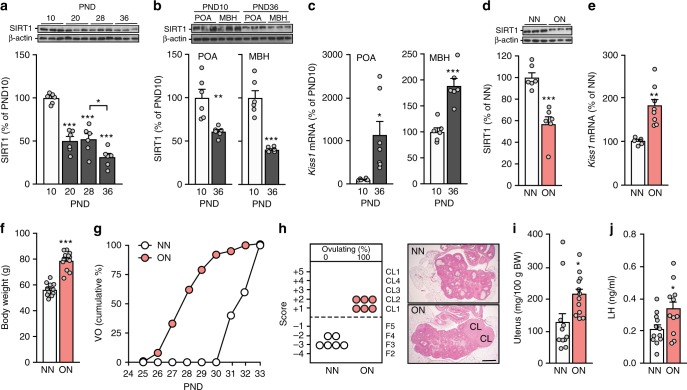
Changes in hypothalamic SIRT1 content and pubertal timing induced by overnutrition. a SIRT1 content in the medial basal hypothalamus (MBH)/Preoptic area (POA) of female rats at the infantile (PND10; white bars), early juvenile (PND20; gray bars), late juvenile/pre-pubertal (PND28; gray bars), and peripubertal (PND36; gray bars) stages of reproductive development, determined by western blot analysis. *p < 0.05 vs. PND28; ***p < 0.001 vs. PND10 (one-way ANOVA followed by post-hoc Tukey test). b, c SIRT1 protein and Kiss1 mRNA content in the MBH and POA at PND10 and PND36; for data in a−c, n = 6 animals per group. d, e SIRT1 content and Kiss1 mRNA levels in the MBH of late juvenile, 29-day-old female rats fed normally (NN: normal nutrition; white bars) or subjected to nutritional excess (overnutrition, ON; light red bars) during postnatal development. f Body weight of NN and ON animals. g Cumulative percent of NN and ON animals at vaginal opening (VO). h Histological score of follicular development/ovulation and representative images of ovarian maturation in NN and ON groups; CL: corpus luteum. i Uterine weight in NN and ON animals. j Plasma LH in the same animals. The bar histograms represent the mean ± SEM. In panels b-f, i and j, *p < 0.05; **p < 0.01; ***p < 0.001 (two-sided Student’s t test). For protein analyses in panels a, b and d, three representative bands per group, run in the same original western blots, are presented. The scale bar in panel h corresponds to 600 μm. Total group sizes were: NN = 11 and ON = 12; while phenotypic and hormonal parameters were assayed in the whole groups, hypothalamic protein/RNA (d, e) and ovarian histological (h) analyses were conducted in a representative subset of randomly assigned samples from each group, with the following distribution: d, e NN = 5; ON = 6−8; h n = 6 in each group

