Fig. 2.
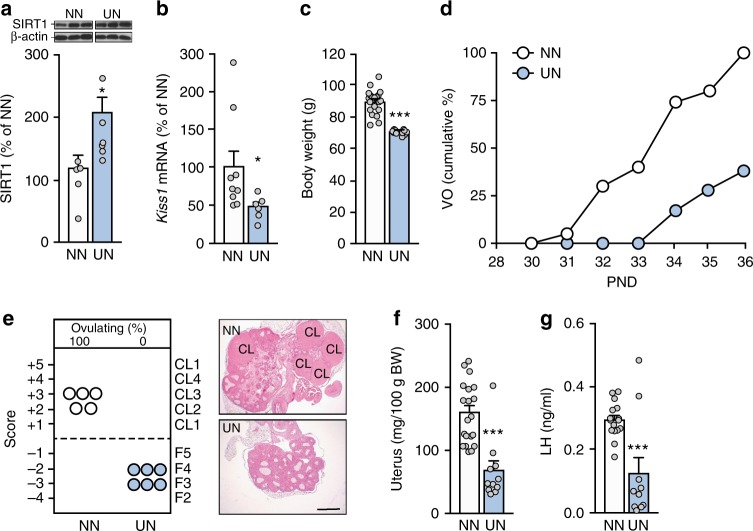
Changes in hypothalamic SIRT1 and pubertal timing induced by undernutrition. a, b SIRT1 content and Kiss1 mRNA levels at PND36 in the MBH of animals fed a normal diet (NN; white bars) or given restricted access to food (undernutrition, UN; light blue bars) during prepubertal development. c Body weight of NN and UN animals. d Cumulative percent of NN and UN animals showing vaginal opening (VO). e Histological score of follicular development/ovulation and representative images of ovarian maturation in the NN and UN groups; CL: corpus luteum. f Uterine weight and g Plasma LH levels. The bar histograms represent the mean ± SEM. *p < 0.05; ***p < 0.001 vs. NN group (two-sided Student’s t test). For protein analyses in panel a, three representative bands per group, run in the same original western blots, are presented. The scale bar in panel e corresponds to 600 μm. Total group sizes were: NN = 20 and ON = 10; while phenotypic and hormonal parameters were assayed in the whole groups (in the case of LH levels, for all serum samples that were available), hypothalamic protein (a) and RNA (b), as well as ovarian histological (e) analyses were conducted in a representative subset of randomly assigned samples from each group, with the following distribution: a n = 5; b n = 6−8; e n = 5−6 determinations

