Fig. 5.
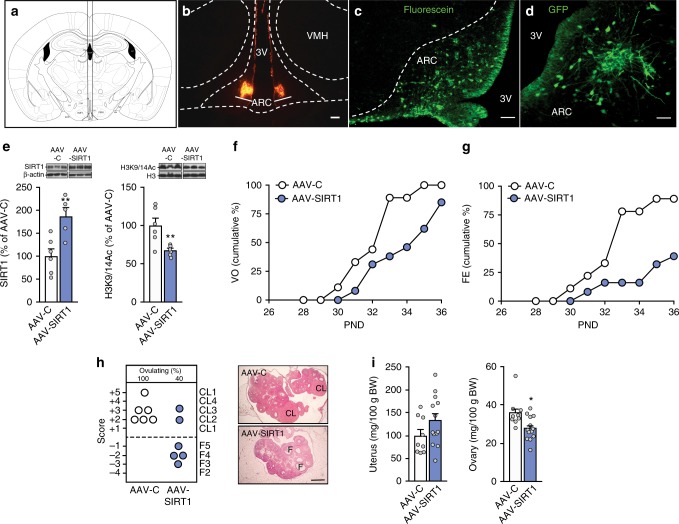
Virogenetic overexpression of SIRT1 in the ARC delays pubertal timing. a Scheme illustrating the stereotaxic delivery of AAV to the ARC. b Representative images of bilateral targeting of the ARC, denoted by fluorescence latex microspheres (beads). c Detail of neuronal targeting in the ARC by stereotaxic injection, denoted by fluorescein. d AAV-mediated infection of ARC neurons by stereotaxic delivery, denoted by GFP labeling. e SIRT1 content and acetylated K9/14 H3 vs. total H3 (AcH3/H3) ratios in the MBH of immature rats injected with AAV overexpressing SIRT1 (AAV-SIRT1) or their respective controls (AAV-C). f, g Cumulative percent of AAV-C- and AAV-SIRT1-treated rats showing vaginal opening (VO) or first estrus (FE). h Histological score of follicular development/ovulation and representative images of ovarian maturation; CL: corpus luteum, F: follicle. i Uterine and ovarian weights in AAV-C and AAV-SIRT1 groups. The bar histograms represent the mean ± SEM. *p < 0.05; **p < 0.01 (two-sided Student’s t test). For protein analyses in panel e, three representative bands per group, run in the same original western blots, are presented. The scale bars correspond to 100 μm in panels b, c, 200 μm in panel d, and 400 μm in panel h. Total group sizes were: AAV-C = 9 and AAV-SIRT1 = 13; while phenotypic parameters were assayed in the whole groups, hypothalamic protein (e) and ovarian histological (h) analyses were conducted in a subset (n = 6) of randomly assigned samples from each group. Bar graphs of the AAV-C group are in white, while bars from AAV-SIRT1 are in blue

