Fig. 6.
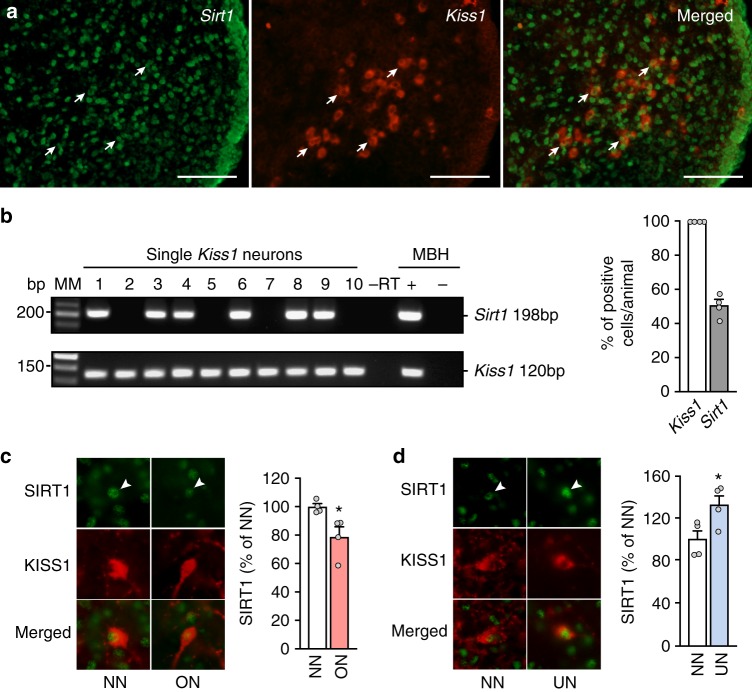
Sirt1 is expressed in KNDy neurons and SIRT1 content changes with nutritional status. a Fluorescent in situ hybridization (FISH) using a cRNA complementary to Kiss1 mRNA (red) and a cRNA probe recognizing Sirt1 mRNA (green) in KNDy neurons of the ARC. Arrows point to examples of double labeled cells. Scale bars, 100 µm. b A representative gel illustrating the presence of Sirt1 and Kiss1 mRNA in ten eGFP-tagged mouse KNDy neurons (1−10) of adult ovariectomized female mice as detected by single-cell (sc) PCR. As a negative control, the PCR reaction was performed on a Kiss1-GFP cell in the absence of reverse transcription (−RT). Other negative controls (showing no PCR product) included harvested aCSF and water blank. RNA extracted from the MBH was included as a positive control (+, with RT) and negative control (−, without RT). MM molecular markers, bp base pairs. The bar graph represents the mean ± SEM of the percentage of KNDy neurons expressing Sirt1 per animal from four mice and a total of 96 harvested Kiss1-positive cells. c, d Immunohistofluorescence detection of SIRT1 (green) and kisspeptin (red) from the ARC of NN (normal-nutrition) vs. ON (overnutrition) rats at PND29 (panel c), or NN vs. UN (undernutrition) animals at PND36 (panel d). Bar graphs represent the mean ± SEM of the percentage of SIRT1 signal intensity in kisspeptin-positive cells from 30 to 50 neurons per animal, normalized against NN data. *p < 0.05 (two-sided Student’s t test) (n = 4 animals per group). NN = white bars; ON = light red bars; UN = light blue bars

