Fig. 1.
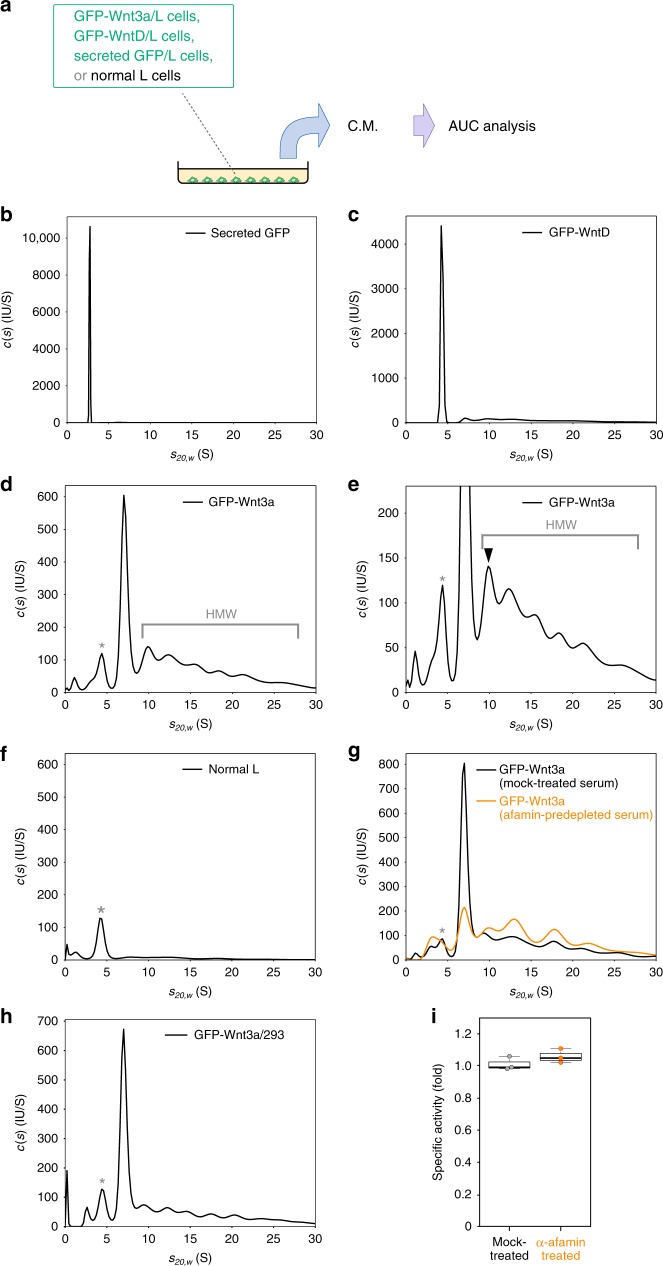
Analytical ultracentrifugation analyses of GFP-tagged Wnt3a proteins secreted from cultured cells. a Schematic representation of the analysis using AUC. b–f AUC-FDS analysis of secreted GFP (n = 3; (b)), GFP-tagged Drosophila WntD (GFP-WntD; n = 7; (c)), and GFP-tagged mouse Wnt3a (GFP-Wnt3a; n = 20; (d, e)), secreted from stably transformed mouse L cells. As a negative control, AUC-FDS analysis of conditioned medium (C.M.) from neomycin-resistant L cells is also indicated (n = 4; (f)); e is an enlarged version of d. HMW indicates high-molecular-weight complex. The closed arrowhead in e indicates the HMW complex with the smallest molecular mass (~9.6 S corresponding to ~200 kDa). g AUC-FDS analysis of GFP-Wnt3a in culture media with mock-treated (black; n = 3) or afamin pre-depleted (orange; n = 3) serum. The relative area size of the Wnt3a/afamin complex peak, which was normalized by the whole area size obtained in each measurement, was significantly decreased by afamin pre-depletion (relative area of ~ 7.0 peaks was decreased from 35.1 ± 6.6% to 14.1 ± 1.5% by the pre-depletion (mean ± s.d., p < 0.05); whereas that of the HMW peaks was increased from 51.1 ± 4.8% to 69.6 ± 1.2% (mean ± s.d., p < 0.05, n = 3, paired t-test). h AUC-FDS analysis of GFP-Wnt3a secreted from HEK293 cells (n = 4). i Wnt signaling activity of GFP-Wnt3a in culture media with mock-treated (black) or afamin pre-depleted (orange) serum. Wnt activity monitored by use of the SuperTOPFlash assay was normalized by the fluorescence intensity of GFP. Peaks marked with asterisks in d–h appeared to be derived from fluorescent molecules bound to serum albumin, such as bilirubin (Supplementary Fig. 3f)

