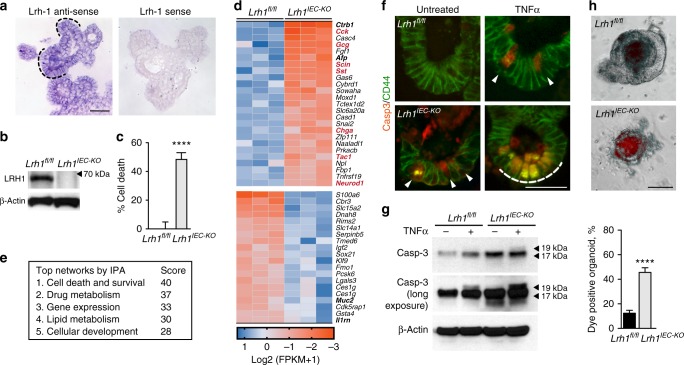
Fig. 1.
Effects of loss of LRH-1 on murine organoids. a Expression of mLRH-1 transcripts in intestinal organoids is widespread and higher in crypt regions (dashed black line). Scale bar = 100 μm. b Loss of mLRH-1 after Cre-recombination induced by 4-hydroxytamoxifen (4OHT) added to Lrh-1fl/fl;Vil-CreERT2 organoids for 48 h (Lrh1IEC-KO) compared to similarly treated wild-type (Lrh1fl/fl) organoids, as detected by anti-LRH-1 antibody. c Cell death in Lrh1fl/fl and Lrh1IEC-KO organoids following acute loss of Lrh-1. Values normalized to five independent wells of untreated Lrh1fl/fl organoids taken to be 0%. d Most significant gene changes up (blue) or down (ochre) after loss of mLRH-1 by RNA expression (q = < 0.05 and p = < 0.005). Gene names in bold refer to markers of differentiation while red refer to known EEC markers. e Top five altered gene networks as identified by IPA Ingenuity analysis. f Lrh1fl/fl and Lrh1IEC-KO organoids exposed to TNFα (10 ng/ml) for 40 h stained for active Casp3 (red) and CD44 (green). Cells expressing active Casp3 undergoing cell death in crypt regions are indicated (white arrowheads and dashed white line). Scale bar = 50 μm. g Expression of active Casp3 in Lrh1fl/fl and Lrh1IEC-KO organoids as described in panel f, detected by western blotting (17 and19 kDa, black arrowheads). Shorter (top panel) and longer exposures (middle panel). h Uptake of fluorescent dextran after 30 min in Lrh1fl/fl and Lrh1IEC-KO organoids. Scale bar = 100 μm. Bar graph of percentage dye-positive enteroids (≥30 total organoids counted per condition). Data represent average of minimum three biological triplicates. For c and g, error bars are SEM using Student’s t test (unpaired, two tailed) with p values of ****p = < 0.0001

