Fig. 5.
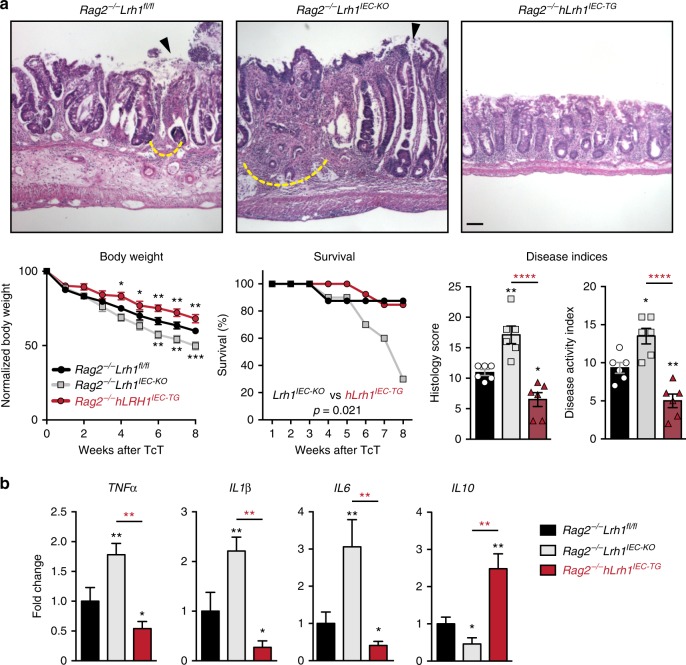
hLRH-1 overexpression decreases disease severity in T-cell transfer colitis. a Representative histology from T-cell transfer colitis model for Rag2−/−Lrh1fl/fl, Rag2−/−Lrh1IEC-KO, and the LRH-1 overexpressing mouse line Rag2−/−Lrh1IEC-TG. Areas of mucosal erosion indicated with black arrowhead, crypt destruction indicated with dashed yellow line. Animal weight loss, survival during disease course, histology scores, and disease activity index are plotted below. Animal weight loss was normalized to nondiseased control at each time point. Scale bar = 100 μm. b Relative RNA levels of inflammatory and regulatory cytokines from colonic tissue of inflamed colon. Black and red asterisk symbols indicate comparison with Rag2−/−Lrh1fl/f and Rag2−/−Lrh1IEC-TG groups, respectively. Survival curves were determined by Kaplan−Meier survival analysis and Log-rank test; error bars are SEM. Statistical analyses for normalized body weights determined by two-way ANOVA and for histology and disease activity index determined by one-way ANOVA with p values of *p = < 0.05, **p = < 0.01, and ****p = < 0.0001. For weight analysis, n = Rag2−/−Lrh1fl/fl no TcT (n = 4), Rag2−/−Lrh1IEC-KO (n = 6), Rag2−/−Lrh1IEC-TG (n = 6). For survival analysis, n = Rag2−/−Lrh1fl/fl (n = 8), Rag2−/−Lrh1IEC-KO (n = 10), Rag2−/−Lrh1IEC-TG (n = 13). For DAI, histology score and qPCR analysis, n = 6 for each group

