Figure 4.
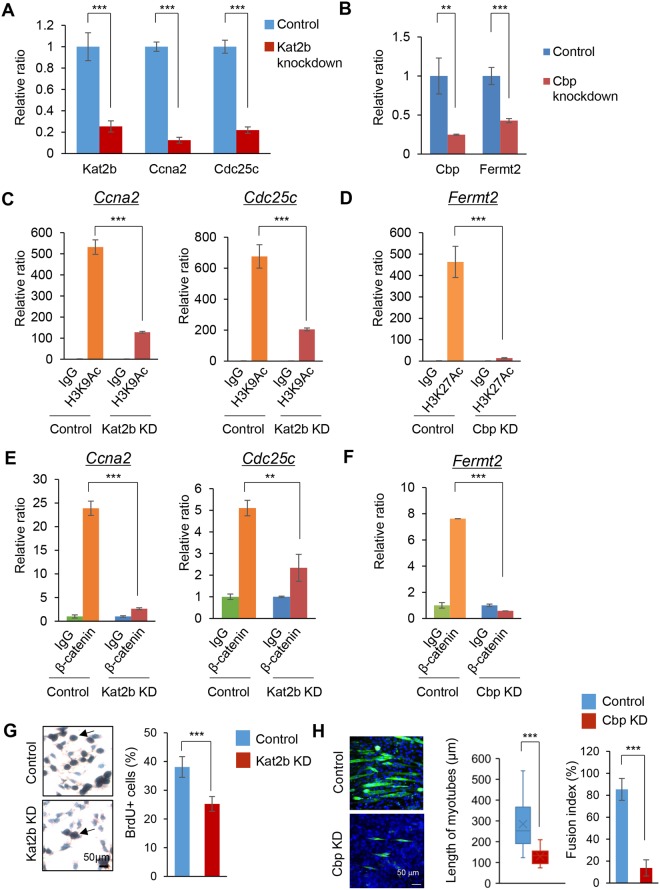
HATs and β-catenin coordinately regulate cell proliferation and differentiation through the regulation of Ccna2, Cdc25c and Fermt2. (A) Quantitative RT-PCR analysis of indicated genes after siRNA knockdown of control (blue) or Kat2b (red) (n = 3 each group). ***p < 0.001. (B) Quantitative RT-PCR analysis of indicated genes after siRNA knockdown of control (blue) or Cbp (red) (n = 3 each group). **p < 0.01, ***p < 0.001. (C) ChIP-qPCR analysis of H3K9Ac on the Ccna2 and Cdc25c promoter regions with Kat2b siRNA knockdown for 24 hours at the proliferation stage. ChIP with IgG with control siRNA (green), IgG with Kat2b siRNA knockdown (blue), α-H3K9Ac antibody with control siRNA (orange), and α-H3K9Ac antibody with Kat2b siRNA knockdown (red) (n = 3 each group). ***p < 0.001. (D) ChIP-qPCR analysis of H3K27Ac on the Fermt2 promoter region after Cbp siRNA knockdown for 24 hours at the proliferation stage. ChIP with IgG with control siRNA (green), IgG with Cbp siRNA knockdown (blue), α-H3K27Ac antibody with control siRNA (orange), and α-H3K27Ac antibody with Cbp siRNA knockdown (red) (n = 3 each group). ***p < 0.001. (E) ChIP-qPCR analysis of β-catenin binding on the Ccna2 and Cdc25c promoter regions following Kat2b siRNA knockdown for 24 hours at the proliferation stage. ChIP with IgG with control siRNA (green), IgG with Kat2b siRNA knockdown (blue), α-β-catenin antibody with control siRNA (orange), and α-β-catenin antibody with Kat2b siRNA knockdown (red) (n = 3 each group). **p < 0.01, ***p < 0.001. (F) ChIP-qPCR analysis of β-catenin binding on the Fermt2 promoter region following Cbp siRNA knockdown for 24 hours at the proliferation stage. ChIP with IgG with control siRNA (green), IgG with Cbp siRNA knockdown (blue), α-β-catenin antibody with control siRNA (orange), and α-β-catenin antibody with Cbp siRNA knockdown (red) (n = 3 each group). ***p < 0.001. (G) BrdU staining in C2C12 cells after control or Kat2b siRNA knockdown (KD) for 24 h. Nuclei are counterstained with hematoxylin. Arrows indicate BrdU-positive cells. Scale bar, 50 µm. Graph shows the quantification of BrdU-positive cells. ***p < 0.001. (H) Immunocytochemical analysis of MYH (green) in differentiated C2C12 cells with control or Cbp siRNA knockdown (KD). Scale bar, 50 µm. Graph shows the quantification of the length of myotubes (middle) and fusion index (right). ***p < 0.001.

