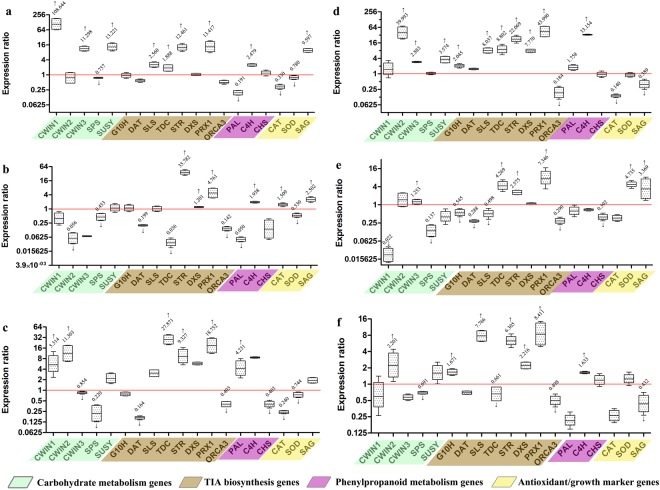
Figure 3.
Gene expression profiles of soluble sugar, TIA metabolism genes, phenylpropanoid metabolism and antioxidant genes. Expression profile in (a) cold stress, (b) drought, (c) salinity, (d) sucrose, (e) UV radiation and (f) wound- treated tissues. The Results depict statistically significant (p < 0.05) Up/downregulation of the considered genes determined via three independent replicates in qRT-PCR. Data were analysed using LinREG PCR and REST software. Mean factors of gene expression compared to control group are represented as boxplots. Corresponding expression ratios of the genes significantly affected (p < 0.05) are shown next to the whisker-boxes. The median expression ratio values above/ below 1.0 indicate up/ downregulation of the target gene under stress treatment compared to the control leaves, indicated using upward and downward arrows.

