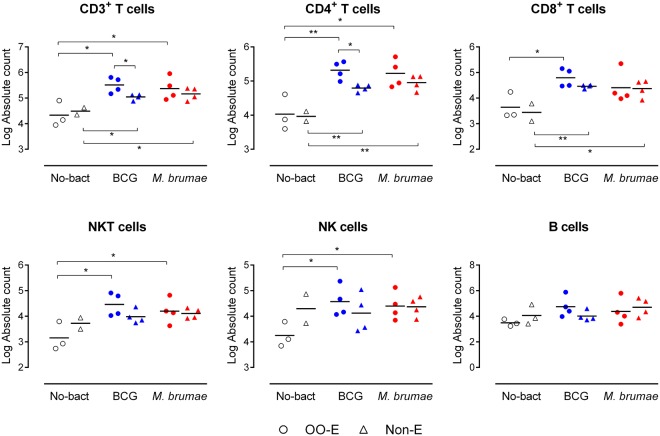
Figure 1.
Infiltrated immune cells into mycobacteria-treated and non-treated tumor bearing mice 29 days after tumor induction. Absolute number of T cells (CD3+, CD4+ and CD8+ subsets), NKT cells, NK cells and B cells that infiltrated the bladder. The different groups of animals are indicated using different colors on the horizontal axis of the graph: non-mycobacteria treated mice (No-bact) are represented by empty black symbols, BCG-treated mice by blue symbols and M. brumae-treated mice by red symbols. Dots represent animals treated with emulsion or emulsionated mycobacteria, triangles represent mice treated with PBS or mycobacteria in PBS. *p < 0.05; **p < 0.01.

