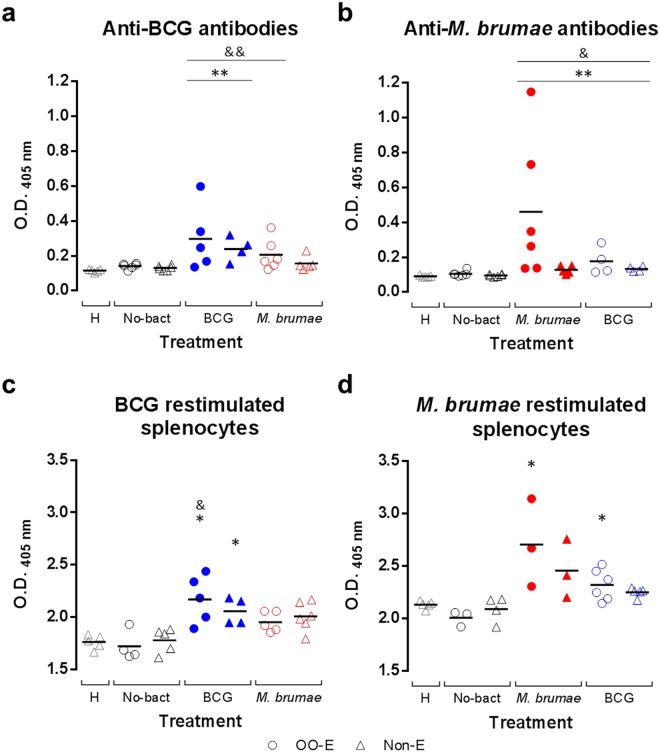
Figure 3.
Systemic immune responses in tumor-bearing and healthy mice. Levels of anti-BCG (a) and anti-M. brumae (b) IgG antibodies present in sera from BCG-treated, M. brumae-treated and non-treated tumor-bearing mice, as well as in healthy animals. The presence of BCG antibodies in M. brumae-treated mouse serum is represented by empty blue symbols (b) and the presence of M. brumae antibodies in BCG-treated mouse serum by empty red symbols (a). For a and b, solid lines represent the mean of the OD (405 nm) values (two technical replicates) of the six mice from each group. *p < 0.05 compared to No-bact. &p < 0.05 compared to H. Splenocyte proliferation after ex vivo BCG (c) and M. brumae (d) restimulation. Proliferation is expressed relative to non-restimulated splenocytes of the same animal (proliferation of restimulated splenocytes/proliferation of non-restimulated splenocytes) after BCG and M. brumae stimulation. Proliferation of splenocytes from M. brumae-treated animals restimulated with BCG antigens is represented by empty red symbols (c) and proliferation of splenocytes from BCG-treated animals restimulated with M. brumae antigens is represented by empty blue symbols (d). For c and d, solid lines represent the mean of relative proliferation (three technical replicates) of 3–6 different spleens from each animal group. *p < 0.05 compared to No-bact. &p < 0.05 compared to H. For a, b, c, and d, dots represent animals treated with emulsified preparations and triangles represent animals treated with non-emulsified preparations. The different groups of animals are indicated by different colors on the horizontal axis of the graph as follows: empty grey triangles for the healthy (H) mice, empty black symbols for tumor-bearing mice receiving no mycobacteria treatment (No-bact), blue symbols for BCG-treated mice, and red symbols for M. brumae-treated mice.

