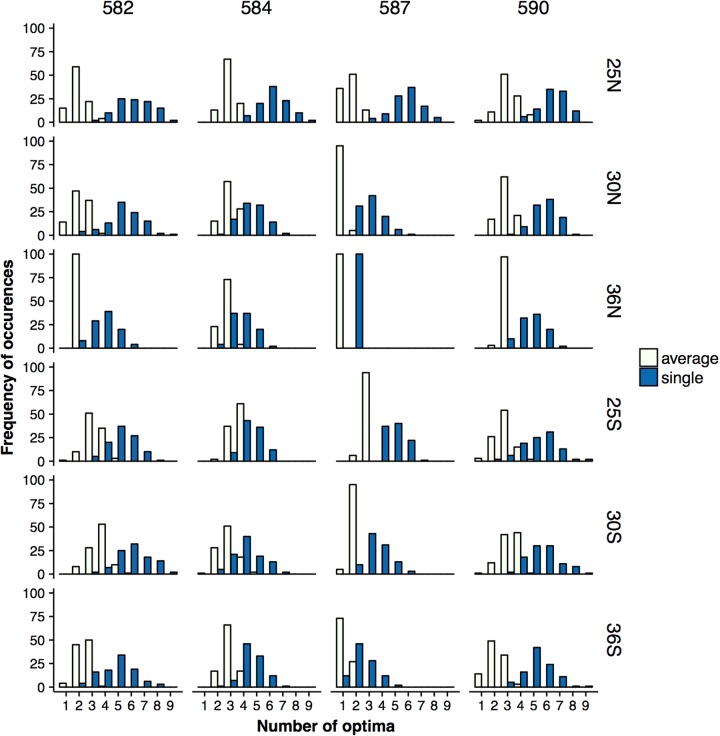
Fig. 5.
Number of optima observed from 100 posterior samples of single-effect (dark blue) and averaged (light yellow) landscapes for positions 582, 584, 586, and 590 (from left to right) across environments. (See Fig. S14 for the complete set of loci.) The number of optima is always larger in single-effect than in averaged landscapes. The number of optima is smaller at high temperatures, which may indicate increased constraints to adaptation. The large difference between the number of peaks in averaged and single landscapes suggests that synonymous mutations can affect adaptation to a new environment by trapping the population at a local optimum. The mean and median of the distributions are significantly different according to Welch two sample t-test and Wilcoxon test, p < 0.00001 after Bonferroni correction for 54 comparisons

