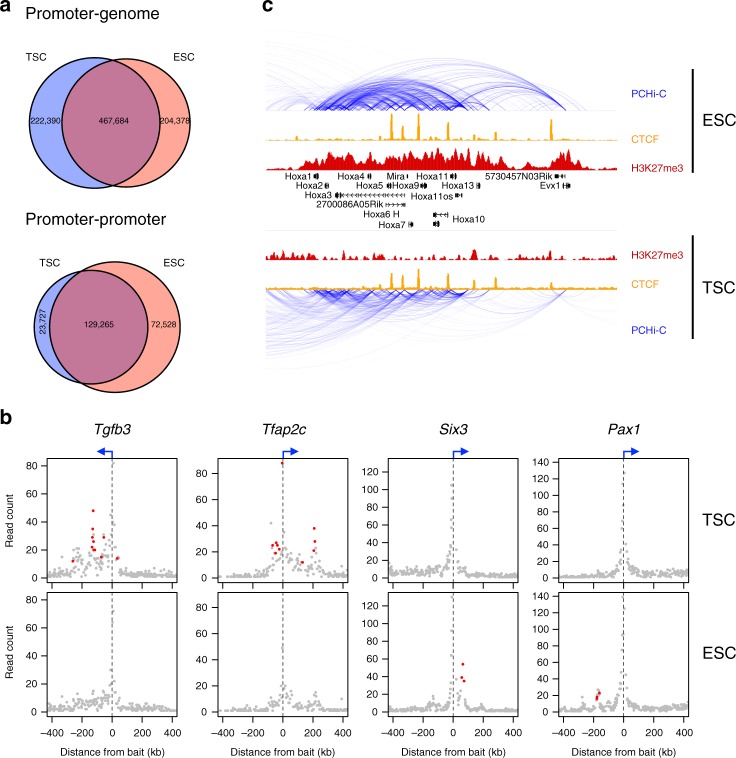
Fig. 1.
Differential interactions between TSCs and ESCs. a Venn diagrams comparing the significant interactions from TSC and ESC PCHi-C data, separated into interactions with non-promoter regions (promoter–genome) or with other promoters (promoter–promoter). b Examples of differential interactions between TSCs and ESCs. Read counts of fragments interacting with selected promoters are displayed, with differential interactions highlighted in red. c Genome browser view of the Hoxa gene cluster highlighting a reduction in intra-cluster interactions in TSC cells

